Cell Type Guidelines & Optimization

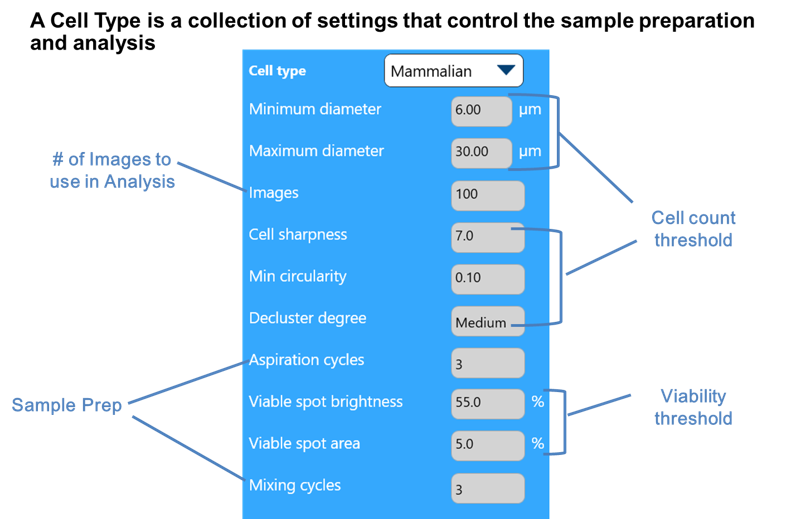
BLU includes 7 system cell types:
- BCI Default – general use
- Mammalian - CHO, HEK, PBMC
- Insect – SF-9, SF-21
- Yeast- biofuel, breweries, fermentation applications
- BCI Viab Beads – for use with BLU viability control
- BCI Conc Beads – for use with BLU concentration controls
- BCI L10 Beads – for use with L10 (10um) size standard
For many cell types, the default cell type values provided in the software are suitable. For some Cell Lines, parameters will need to be changed to optimize the analysis of the cells.
Migrating cell types from XR to BLU
Suggested conversion values. Please contact your Beckman Coulter Life Sciences representative for more assistance.
| XR Setting | BLU Setting Starting Value | |
|---|---|---|
| Min | Same | -1 um |
| Max | Same | -1 um |
| Images | 50 | 50 or 100 |
| Aspirate | Same | 3 |
| Mix | Same | 3 |
| Cell Brightness | 85 | N/A |
| Cell Sharpness | 100 | 7 |
| 80 | 15 | |
| 60 | 20 | |
| Viable Spot Brightness | 85 | 55 |
| 75 | 50 | |
| 65 | 40 | |
| Viable Spot Area | Same | Same |
| Min Circularity | Same | Same |
| Decluster | Same | Same |
| Cell Type Parameters | Typical Range | Full Range | Increase Value | Decrease Value | When/Why You Want to Change This | Warnings | |
|---|---|---|---|---|---|---|---|
|
Defines whether there is a cell present or not |
Minimum Diameter |
5 to 12 µm |
1 to 60 µm |
Less cells identified |
More cells identified |
Software is excluding small cells (circled blue) Debris included in analysis |
Too low, may be including debris Too high, cells excluded |
|
Maximum Diameter |
15 to 50 µm |
1 to 60 µm |
More cells identified |
Less cells identified |
Software is excluding large cells (circled blue) Clumps of cells are included |
Too low, may be excluding cells Clumps of cells included |
|
|
Cell Sharpness |
5 to 25 |
0 to 100 |
Less cells identified |
More cells identified |
Software is excluding "fuzzy" cells Unwanted debris is being picked up |
Set too high may cause dead cell to be excluded and alter the percent viability. |
|
|
Defines whether identified cells are viable or dead |
Viable Cell Spot Brightness |
40 to 60% |
0 to 95% |
More cells identified as dead |
More cells identified as viable |
Viable cells are identified as dead Dead cells are identified as viable |
Too low, may start identifying dead cells as live Too high, may start identifying live cells as dead |
|
Viable Cell Spot Area |
3 to 12% |
0 to 95% |
More cells identified as dead |
More cells identified as viable |
Viable cells are identified as dead Dead cells are identified as viable |
Too low, may start identifying dead cells as live Too high, may start identifying live cells as dead |
|
|
Defines whether there is a cell present or not |
Minimum Circularity |
0 to 0.60 |
0 to 1.00 |
More irregular shaped dead cells will be excluded |
Less irregular shaped dead cells will be excluded |
Unwanted irregular shaped debris are being picked up |
Too low, may be capturing unwanted debris Too high, may start excluding cells |
|
Decluster Degree |
None, Low to Medium |
N/A |
More cells identified |
Less cells identified |
Single cells are being identified as 2 or more cells |
Too low, may be missing cells in clusters Too high, may over decluster by annotating single cells as 2 or more cells |
|
|
|
|||||||
|
Cell Sharpness |
Cell sharpness is a measure of cell edges ranging from 0-100. Decreasing the value allows for fuzzier objects to be identified as cells. Increasing the sharpness will eliminates fuzzier cells from the cell count. |
||||||
| Viable Cell Spot Brightness |
Viable Cell Spot Brightness measures the brightness of the center of the cells to determine whether the cell is viable or dead (green or red annotation). At high values cells with bright white centers are counted as viable (viability will decrease). At low values cells with grey centers will be counted as viable (viability will increase). It is important to check annotation to determine if Viable Cell Spot Brightness is set correctly. |
||||||
|
Viable Cell Spot Area |
Viable Cell Spot Area is a percentage of the white area of a cell used to determine if the cell is viable or dead. A high value may cause some viable cells to be counted as dead. It is normally not necessary to adjust this parameter. |
||||||
|
Minimum Circularity |
This parameter is used to eliminate debris. Assume "1" is a perfect circle. |
||||||
|
Decluster Degree |
The declustering degree defines intensity of declustering clumps of cells. None will not decluster any clumps of cells - Good for samples with cells that are very long and contain no cell clumps. Low is good for samples with clumps of 2-3 cells. Medium is good for samples with some clumps of with more than 3 cells. High is good for yeast cells. |
||||||
a

