Analyze Your Flow Cytometry in Real Time with Kaluza
The Kaluza Analysis Software interface is designed to let you focus on the data. The context specific radial menu provides access to every aspect of your data. Real time processing and unlimited undo make the effect of changes readily visible and facilitate data exploration.Interface Overview
See the steps for uploading files and getting started with your analysis.
Experience the inductive prompts and context specific menus.
Get a sense of the real time exploration of data by watching the interface react to adjustments.
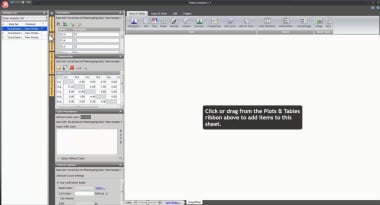
Take a tour of the layout, four panels provide access to all controls needed to interact with the data. Analysis List includes all of the loaded files, Attributes Pane gives access to Parameters, Compensation Matrix, Color Precedence for gating, and Protocol Options for absolute counting.

Creating and Adjusting Plots
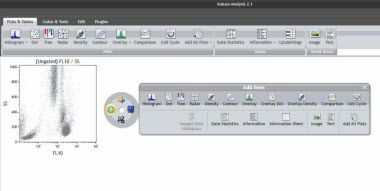
Use the ribbon menu to select plot type. Select the parameter to display by clicking on the axis. Try something different by right clicking to display the context specific radial menu. Swap the axis or change from dot to density plot without starting over.
Choose gates from the ribbon or radial menu. Try the Add All Plots function to display all logical combinations.
Adjust the plot scale using the radial menu or adjust using visual sliders. Sliders are also available to adjust the compensation.

Analyzing Multiple Files
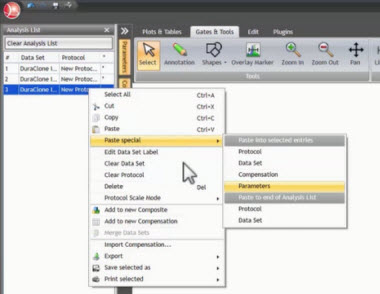
Use drag and drop to apply the analysis to other files in the Analysis List.
To compare the results from several files, create a Composite. This allows the data from different acquisitions to be displayed next to each other and to create overlays.
The Batch Analysis feature allows you to go through multiple files quickly.

Specialized Plot Types
Kaluza offers analysis of multidimensional data. Work in full range mode to display the original instrument scaling.
Use the Radar Plot to view a qualitative view of multiple parameters on the same plot. Change the orientation and length of an axis to improve the separation of clusters.
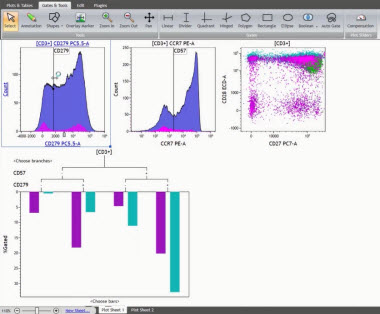
The patented Tree Plot allows the comparison of two subsets and is the fastest way to get statistics for all marker combinations. Use the branches as gates for further analysis.
Comparison Plots compare a given statistic over up to twelve data sets and populations.


