Robust Performance
A key objective of adding a viability dye to the panel design is to allow for the discrimination of dead cells from subsequent gates. Dead cells bind antibodies non-specifically which can skew the population analysis. If the reagent loses effectiveness staining is reduced leading to more dead cells appearing to be live. Or if staining is aberrantly increased, more cells will appear dead. Consistent stable reagents are required for robust assay performance.
Beckman Coulter fully characterizes the quality of our reagents. Multiple lots of each reagent are tested by multiple operators to determine the recommended staining concentration and incubation time. Each new lot is evaluated to ensure that established QC parameters are met.
| ViaKrome 405 | ViaKrome 561 | ViaKrome 638 | ViaKrome 808 | |
|---|---|---|---|---|
| Trial 1 | 19.6 | 19.8 | 21.2 | 15.5 |
| Trial 2 | 19.3 | 23.9 | 21.8 | 17.9 |
| Trial 3 | 21.0 | 20.6 | 22.9 | 17.0 |
| Trial 4 | 17.4 | 24.0 | 17.8 | 16.3 |
| Mean % of Dead Cells | 19.3 | 22.1 | 20.9 | 16.7 |
| SD | 1.5 | 2.2 | 2.2 | 1.0 |
| CV% | 7.6% | 9.9% | 10.6% | 5.9% |
Assay Precision. A mixture of Jurkat cells and heat stressed (55 °C for 10 minutes) Jurkat cells were stained with the indicated ViaKrome Fixable Viability Dye. Samples were acquired immediately post staining (n=4). The dead cell population as a percentage is indicated and statistical analysis of the variation is indicated. Assay CV ranged from 5.9 to 10.6%.
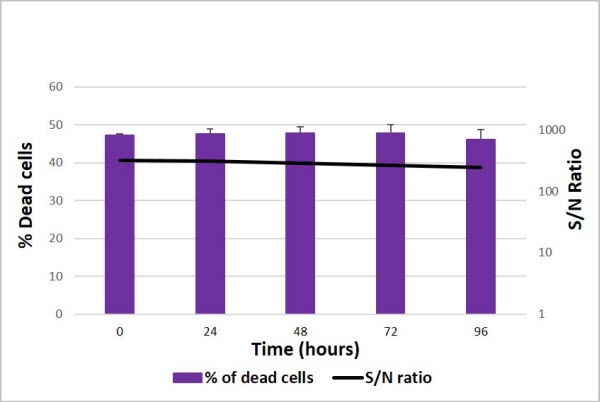
Stability at 18-25° ViaKrome 405 Fixable Viability Dye

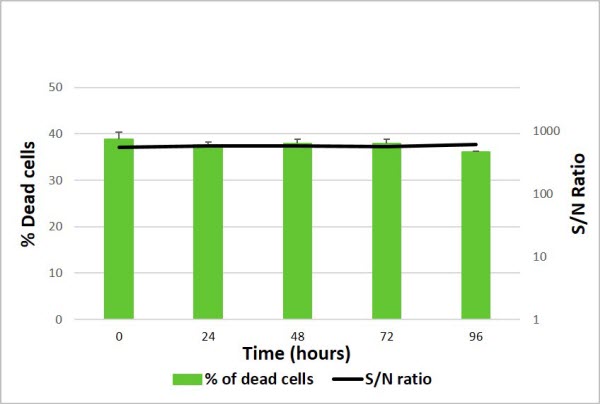
Stability at 18-25° ViaKrome 561 Fixable Viability Dye

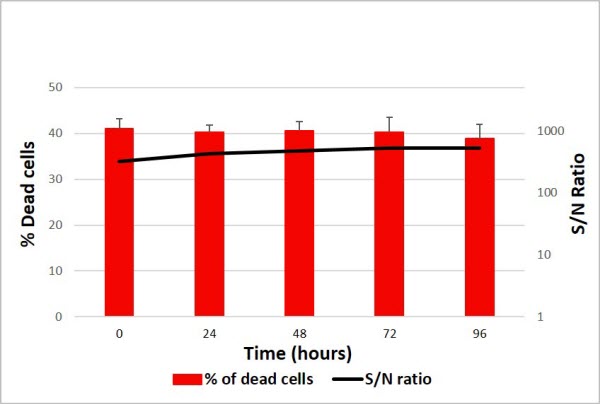
Stability at 18-25° ViaKrome 638 Fixable Viability Dye

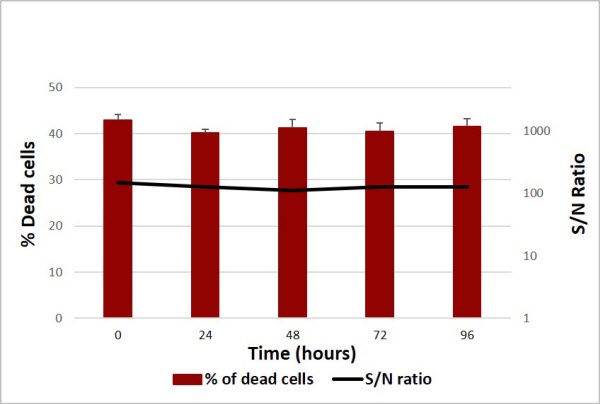
Stability at 18-25° ViaKrome 808 Fixable Viability Dye

Stock Solution Stability. The indicated ViaKrome Fixable Viability Dye was reconstituted in PBS and used immediately (0 hours) or stored at 18-25 °C for the indicated time up to 4 days (96 hours) protected from light. A mixture of Jurkat cells and heat stressed (55 °C for 10 minutes) Jurkat cells were stained and data were acquired on the CytoFLEX LX Flow Cytometer. The graph shows the percentage of dead cells (bars) and the signal to noise ratio (line) for each time point. Both measures remain consistent over the period studied.

