Automating Biopharma Quality Control to Reduce Costs and Improve Data Integrity
Abstract
One report suggests that an average pharmaceutical manufacturing factory spends around $40M per year on quality control1. At the same time another report states that 79% of all 483 Warning Letters issued by the FDA in 2016 cited 21 CFR Part 11 data integrity issues2. Whilst re-training is a common response to an FDA 483 Warning Letter, this may be only part of the solution: was the problem simply that the worker(s) didn’t follow the SOP correctly, or was it really that manual SOPs are simply not robust enough to prevent future recurrences of the problem? Any process that automates the quality control SOP can potentially both reduce the impact of human error on data integrity issues and also bring welcome savings by reducing the time technicians need to devote to carrying out the SOP. This paper takes a look at four common quality control procedures and how automation can help improve data integrity by reducing opportunities for human error, whilst also saving time and reducing operating costs. The four quality control procedures discussed in this paper form a common thread in the biopharmaceutical manufacturing industry and are water quality testing, cleanroom routine environmental monitoring, biological cell counting and viability testing and final injectable drug particulate testing.
To watch the webinar from Global Product Manager Tony Harrison, scroll to the bottom of this page.
Introduction
Despite encouragement from the FDA in their 2004 PAT initiative3, many routine quality control (QC) test procedures in the pharmaceutical industry remain intensely manual and time consuming. A study by the Industrial BioDevelopment Laboratory showed >20% variability in test results between 16 experienced QC technicians performing the same manual SOP4. Clearly the manual SOP could be improved and the technicians re-trained, but such variability in results suggests that the manual process itself is not robust enough to deliver the required levels of quality control. Whilst the technical specifications of similar instrumentation may appear equivalent, when looking to improve quality control QC teams should be looking at the level of automation in the instrument to make QC testing more robust and repeatable. For example a common source of errors in QC testing is sample preparation. An instrument that automates the sample preparation process can bring enhanced reproducibility and robustness to a QC test4.
Additionally, following the FDA PAT initiative, users could consider moving from sole reliance on laboratory-based QC testing, to using the on-line QC instrumentation instead. For example, many companies have validated on-line water quality testing instrumentation on their Purified Water (PW) and Water for Injection (WFI) loops, but they continue to rely on time-consuming laboratory water testing for product release testing. As long as the on-line instruments can be validated and meet the requirements of the pharmacopoeias, it makes sense to at least reduce the amount of laboratory testing and to rely on data from the on-line instruments instead. As the on-line instruments are automated, their use makes the testing more robust by avoiding human error, thus improving data integrity and, at the same time, reducing QC costs.
Purified Water and Water for Injection QC Testing
TOC and conductivity are two of the four critical quality attributes defined for WFI and PW in the United States Pharmacopoeia11. On-line analysers such as the ANATEL PAT700 can be validated to comply fully for both of these key quality attributes according to the pharmacopoeial requirements.
The FDA Process Analytical Technologies (PAT) initiative4 encouraged the pharmaceutical industry to invest in on-line process control instrumentation to ensure in-process quality control rather than relying so heavily on final product quality testing. Right first time quality for batch manufacturing is encouraged because final product testing on pharmaceutical products is a destructive test and, for this reason, 100% batch testing cannot be performed – one slip during sampling and testing and the whole batch may face destruction. To this aim, many pharmaceutical manufacturers are connecting their on-line TOC analysers to their factory control systems so that any potential TOC or conductivity excursions detected can be used to halt production and prevent the chance of potentially contaminated water being mixed with valuable active pharmaceutical ingredients.
With the revision to the European Pharmacopoeia (EP) chapter on WFI now permitting the production of WFI from double pass reverse osmosis (RO) and ultra-filtration12, TOC and conductivity monitoring of pharmaceutical water systems takes on an increasing significance due to the perceived risk of potential contamination break-through in the RO system compared to the secure barrier afforded by a water still.
The 4 FDA water quality attributes for PW and WFI are:
- Inorganic
- Organic
- Endotoxins
- Microbial
In their guidance, the FDA are keen to emphasize that the 21 CFR Part 11 ruling applies only to the data historian where electronic records are kept10. The danger with on-line instruments with their own local data historian built in is that they could attract the full requirements of the 21 CFR Part 11 ruling. Analyzers such as the PAT700 avoid this issue by allowing the local data historian to be disabled, thus ensuring that it does not attract the full 21 CFR Part 11 requirement as a data archive for electronic records.
Traditionally, data from on-line TOC analysers was stored in validated Supervisory Control And Data Acquisition (SCADA) or Distributed Control Systems (DCS) systems, making process control improvements challenging and adding a further significant amount of change control. More modern approaches keep quality critical data records in a separate secure archive, leaving SCADA and DCS systems dedicated to process control only and more agile. In support of this the PAT700 can be configured to automatically send PDF electronic records via secure FTP over Ethernet for review and batch release, thus satisfying the ALCOA requirements for electronic records to be legible, contemporaneous, original and attributable.
Unlike laboratory water quality testing instrumentation which utilise reagents and require manual configuration for each sample and frequent, often daily, calibration, the on-line PAT700 requires no reagents, automates the test protocol and only requires calibration once every 12 months. Calibration and System Suitability Testing SOPs are automated, requiring no manual data entry and pass/fail reports are automatically generated eliminating manual calculations.

Figure 1. The ANATEL PAT700 exports PDF data straight to data archive via Ethernet. The PAT700 calibration standards export certified value, lot number and expiration date via RFID.
Cleanroom Routine Environmental Monitoring
Of course GMP mandates the air quality conditions for biopharmaceutical production in cleanrooms. In fact the real danger is the microbes on the human body. Humans shed around 30,000 skin cells per hour5, all of which are potential carriers of microbes. Unfortunately we do not currently have technology to detect airborne microbes real-time, so air particle counters are used as a surrogate.
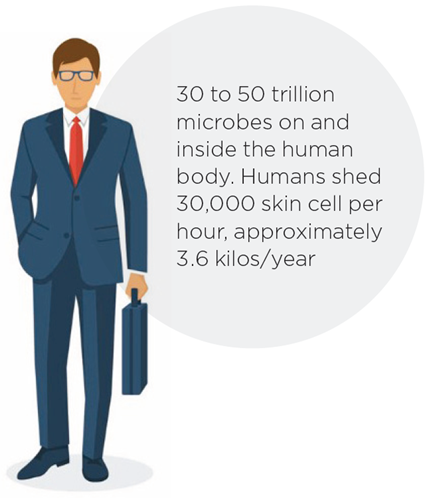
Figure 2. Humans and microbial contamination
Discussions between the author and Environmental Monitoring Managers at facilities across the world highlights an increasing trend where the burden of carrying out environmental monitoring is moving away from the QC microbiology team over to the production staff, for two reasons: a) microbiology staff are relatively expensive to employ to carry out such routine tasks and b) it reduces the number of people inside the cleanrooms, thus reducing the potential for product contamination. However, the production team do not have the same level of knowledge about routine environmental monitoring and this is creating challenges itself.
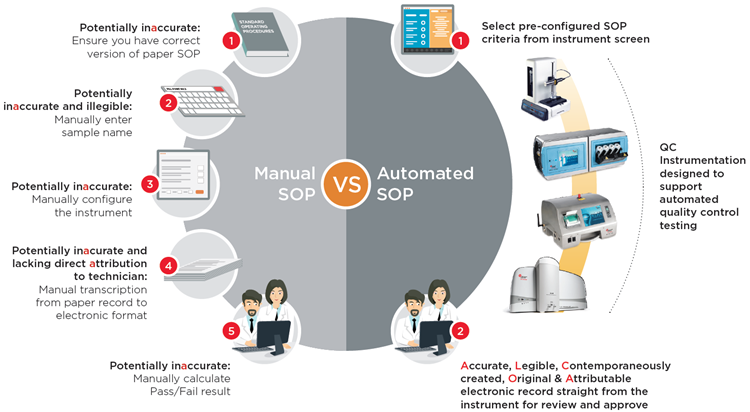
In larger biopharmaceutical manufacturing plants, there can be teams 10 technicians or more whose job it is every month to take thousands of routine environmental monitoring samples. At each sampling location, they have to manually type the location name into the counter before they start sampling. Counters have to be manually configured following written SOPs. At the end of each day, the paper print outs from each sample location have to be photocopied because the printers in the particle counters are thermal and the print-outs fade over time. Then the results from every location have to be manually transferred into electronic format one by one.
Manual Cleanroom Routine Environmental Monitoring SOPs
| Touch-Point 1 |
Touch-Point 2 |
Touch-Point 3 |
Touch-Point 4 |
Touch-Point 5 |
|
• Ensure correct SOP |
Manually type each and every sample location name | Manually configure counter: • Sample time • Number of samples • Results averaging • Correct multiplier for m3 |
Take paper print-out and photocopy | Manually transcribe results |
In an effort to improve data integrity, some manufacturers have optimised their particle counting instrumentation specifically for pharmaceutical QC use, building into the instrument design the capability for pre-configured electronic SOPs including:
- Instrument set-up and configuration
- Automatic pass-fail reports to GMP criteria
- Generation of 21 CFR Part 11 electronic records straight from the instrument
The user simply selects the electronic SOP that has been pre-configured in the instrument and hits the ‘Start’ button and the instrument configures itself correctly according to the SOP, carries out the correct test and produces an electronic test result record, all automatically. This not only improves data integrity, but also can reduce costs as technicians no-longer have to take time collating the paper records and manually transferring the data into electronic records. Additionally, by de-skilling the use of air particle counters through automated SOPs, this process facilitates moving the responsibility for cleanroom routine environmental monitoring from qualified microbiologists over to production staff, further reducing costs.
Collapsing the Routine Environmental Monitoring Workflow with Electronic SOPs
Manual SOP
| Touch-Point 1 |
Touch-Point 2 |
Touch-Point 3 |
Touch-Point 4 |
Touch-Point 5 |
| Manual SOP | Manually enter location name | Manually configure counter | Manually transfer data | Review and approve |
Electronic SOP
| Touch-Point 1 |
Touch-Point 2 |
|||
| Select pre-configured SOP from counter screen |
|
Review and approve results in Excel, PDF or XML | ||
Viable Cell Counting
Cell therapy products in the form of homogeneous cell populations are typically enumerated for concentration and viability based on the cells ability to exclude a supravital dye, such as trypan blue. Traditionally this is done manually using a microscope and haemocytometer, but this method can be both time consuming and error prone. Originally designed for counting blood cells, the sample volume used in the haemocytometer method is typically just 100 nanolitres and small errors using this method caused during sample dilution, mixing, pipetting and visual enumeration by the technician can lead to large errors in results as the final count result is multiplied up to report cell concentration in viable counts/mL. One study revealed variances in the reported cell concentration results between each member of a team of 16 experienced and knowledgeable technicians using the haemocytometer method of up to +/-20%4.
The USP chapter <1046>9 indicates that automated cell counting and viability instruments can provide a higher degree of precision and a more reproducible enumeration. These improvements are optimal if the sample preparation stage is automated, thus reducing the opportunity for technician errors. Additionally, if the automated cell counter can use electronic, pre-programmed cell-counting SOP libraries that match the manual SOPs for cell counting designed by the user, then results are more likely to be accurate and reproducible. As well as improving the precision and reproducibility, automated cell counters can reduce the cost of this QC test by allowing the technicians to carry out other tasks while the counter automates the preparation and counting stages for each sample. Counters that can count from 96-well plates can save significant technician time, hence reducing QC costs. At the same time, by automating the cell counting SOPs making the method more robust and creating the electronic record contemporaneously, data integrity is improved as the results are attributable, legible, contemporaneously created, original and accurate as per the FDA ALCOA guidance in their 21 CFR Part 11 guidance document6.
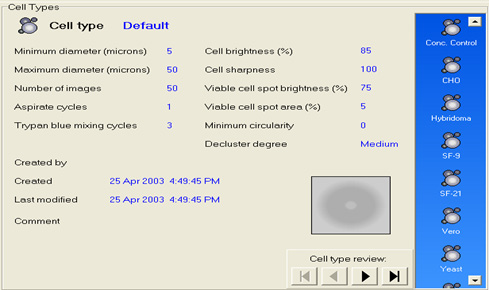
Figure 3. Automated Vi-CELL XR cell counting SOP library screen
Injectable Drug Final Product Particulate Testing
Although largely harmonized, the requirements for parenteral drug particulate testing do vary from country to country and from product to product. The volume of the sample to be analysed and the format that the results are reported varies from product to product, e.g. the sampling requirements for small volume therapeutic protein product, such as vaccines7, is different for that of a large volume parenteral such as an intravenous drip bag8. Results must be calculated and expressed in the correct format, e.g. counts per container, or counts per mL, depending on the product under test.
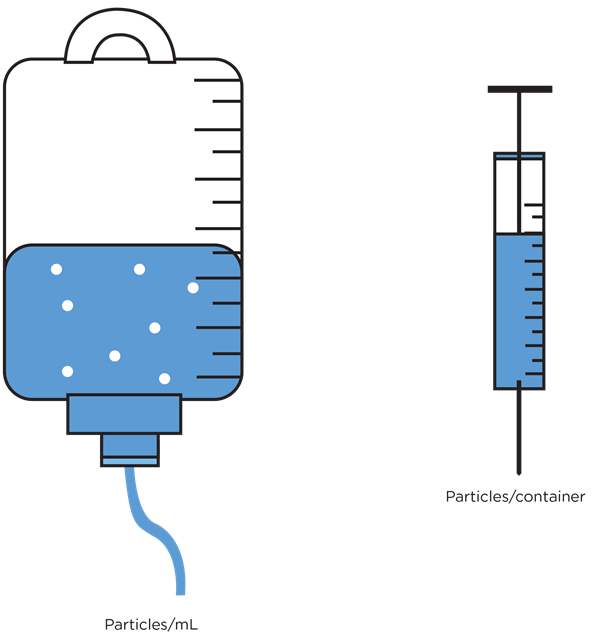
Figure 4. Particulate contamination reporting requirements are product dependent
Whilst general-purpose liquid particle counting instrumentation can be used for the testing of particles in parenteral products, counters that have been optimized for the application are preferable due to the wide range of complexity in the testing. Particle counters that have been optimized for this testing will have the various compendial tests built-in and will calculate a pass/fail result automatically. As QC teams tend to use their product brand name to describe the product sample under test, optimized particle counters will allow the user to select the required test for each sample by selecting the product by name from a drop-down menu.
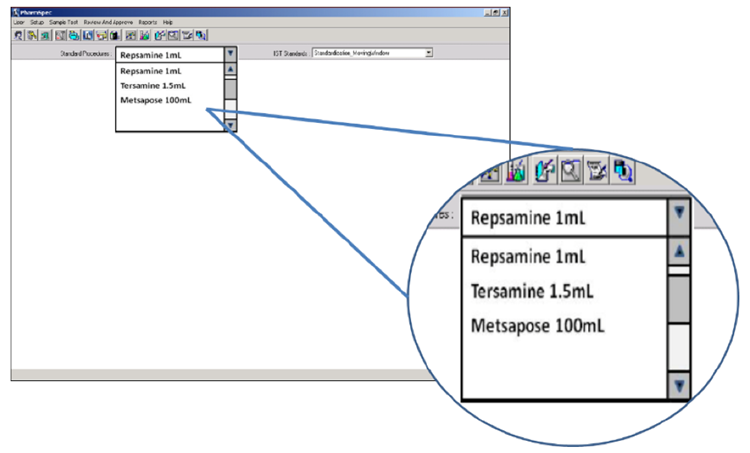
Figure 5. Electronic SOP functionality in the HIAC PharmSpec software allows automated SOP test routines to be named according to the brand name of the product under test and selected by the technician via drop-down box
Conclusion
Whilst the industry focuses on errors and omissions in 21 CFR Part 11 electronic records, the underlying issue is that re-training may be only part of the solution. Manual SOPs are not robust enough to prevent future recurrences of data errors and omissions. QC instrumentation that automate the quality control SOP can potentially both reduce the impact of human error on data integrity issues and also bring welcome cost savings by reducing the time technicians need to devote to carrying out the SOP.
References
- Managing the Cost of Compliance in Pharmaceutical Operations, Frances Bruttin and Dr. Doug Dean, IBM Business Consulting Services, Pharmaceutical Sector, Aeschenplatz 2, CH-4002 Basel, Switzerland, April 2004
- An Analysis of FDA Warning Letters, Barbara Unger, Unger Consulting Inc., Pharmaceutical Online Guest Column, July 14, 2017
- Guidance for Industry: PAT — A Framework for Innovative Pharmaceutical Development, Manufacturing, and Quality Assurance, U.S. Department of Health and Human Services Food and Drug Administration Center for Drug Evaluation and Research (CDER) Center for Biologics Evaluation and Research (CBER) Office of Regulatory affairs (ORA) Division of Drug Information, HFD-240 Center for Drug Evaluation and Research Food and Drug Administration 5600 Fishers Lane, Rockville, MD 20857 USA, September 2004
- Comparison of Manual versus Automated Trypan Blue Dye Exclusion Method for Cell Counting, Kristine S. Louis, Andre C. Siegel, Gary A. Levy, Industrial BioDevelopment Laboratory.
- Health How Stuff Works, How many skin cells do you shed every day?, by Ed Grabianowski. http://health.howstuffworks.com/skin-care/information/anatomy/shed-skin-cells.htm, published July 6, 2010
- Data Integrity and Compliance With CGMP, Guidance for Industry, April 2016, U.S. Department of Health and Human Services Food and Drug Administration Center for Drug Evaluation and Research (CDER) Center for Biologics Evaluation and Research (CBER) Office of Regulatory affairs (ORA) Division of Drug Information, HFD-240 Center for Drug Evaluation and Research Food and Drug Administration 5600 Fishers Lane, Rockville, MD 20857 USA.
- USP<787> Subvisible Particulate Matter In Therapeutic Proteins, Department of Health and Human Services Food and Drug Administration Center for Drug Evaluation and Research (CDER) Center for Biologics Evaluation and Research (CBER) Office of Regulatory affairs (ORA) Division of Drug Information, HFD-240 Center for Drug Evaluation and Research Food and Drug Administration 5600 Fishers Lane, Rockville, MD 20857 USA
- USP<788> Particulate Matter in Injections, Department of Health and Human Services Food and Drug Administration Center for Drug Evaluation and Research (CDER) Center for Biologics Evaluation and Research (CBER) Office of Regulatory affairs (ORA) Division of Drug Information, HFD-240 Center for Drug Evaluation
and Research Food and Drug Administration 5600 Fishers Lane, Rockville, MD 20857 USA - USP<1046> Cell and Gene Therapy Products – Analytical Methodologies, Department of Health and Human Services Food and Drug Administration Center for Drug Evaluation and Research (CDER) Center for Biologics Evaluation and Research (CBER) Office of Regulatory affairs (ORA) Division of Drug Information, HFD-240
Center for Drug Evaluation and Research Food and Drug Administration 5600 Fishers Lane, Rockville, MD 20857 USA - Guidance for Industry, Part 11, Electronic Records; Electronic Signatures — Scope and Application August 2003 U.S. Department of Health and Human Services Food and Drug Administration Center for Drug Evaluation and Research (CDER) Center for Biologics Evaluation and Research (CBER) Office of Regulatory affairs (ORA)
Division of Drug Information, HFD-240 Center for Drug Evaluation and Research Food and Drug Administration 5600 Fishers Lane, Rockville, MD 20857 USA - United States Pharmacopoeia U.S. Department of Health and Human Services Food and Drug Administration Center for Drug Evaluation and Research (CDER) Center for Biologics Evaluation and Research (CBER) Office of Regulatory affairs (ORA) Division of Drug Information, HFD-240 Center for Drug Evaluation and Research Food and Drug Administration 5600 Fishers Lane, Rockville, MD 20857 USA
- European Pharmacopeia (Ph. Eur.) Commission press release 18th March 2016 https://www.edqm.eu/sites/default/files/press_release_water_for_injections_march_2016_0.pdf EDQM Expert Workshop, 24 March 2011 European Directorate for the Quality of Medicines & Healthcare (EDQM) 7 allée Kastner, CS 30026 F -67081, Strasbourg

