Cydem VT Automated Clone Screening System – Generating an Antibody Standard Curve
Figure 1. The Cydem VT Automated Clone Screening System.
Biologic drugs are a rapidly growing sector in the pharmaceutical industry, with an annual growth rate of 12.2%1. A crucial step in this workflow is cell line development (CLD), which is critical for clinical trials or market launch. Monoclonal antibodies (mAbs) have emerged as a leading therapeutic modality in biopharmaceuticals.
To ensure successful translation of antibody drug discovery into clinical and commercial success, it is essential to accurately measure mAb (e.g., IgG) titer in the CLD process. Real-time monitoring of protein titer throughout the bioprocess allows for efficient process optimization and reduced production time. Additionally, early and frequent access to titer data generates a more comprehensive dataset and facilitates better understanding of clone productivity.

Figure 2. The CLD process from cell transfection to scale-up. Screening strategies are implemented at all stages of biologic drug production, with clone selection being the slowest step. Current screening technologies are hindered by limitations, such as high cost and specialized training requirements, preventing the ability to easily obtain titer data.
The Cydem VT system offers a comprehensive and automated solution for top clone screening in upstream development. This instrument allows users to easily assess and quantify antibody production with useful cell viability and growth data to select the optimal cell lines. The measurement of protein titer is achieved through fluorescence polarization, where a sample is mixed with a probe that binds to the Fc region of IgG. The sample is then exposed to polarized light. The probe, a small molecule that rotates rapidly when unbound, causes the light to scatter and lose polarization upon exposure. However, when the probe binds to the ~20 times larger IgG molecule, the rotation slows down, allowing the light to retain its polarization. Therefore, the greater the number of probe-IgG binding interactions within the sample, the more the light will retain its polarization, yielding a higher fluorescence polarization (FP). The module quantifies the polarized light entering the detector, providing the FP value.
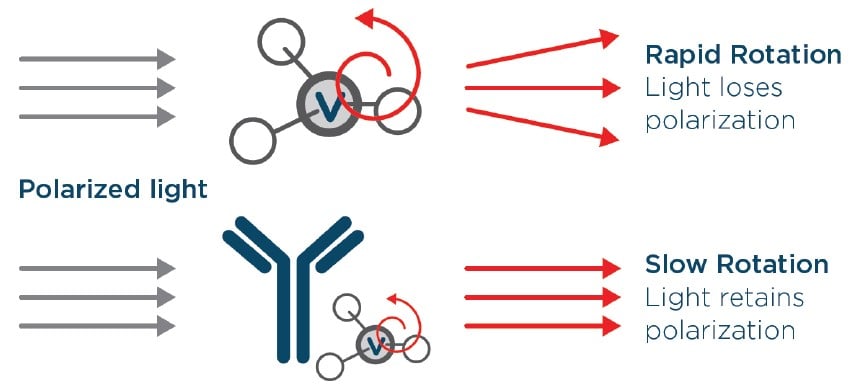
Figure 3. The titer assay utilizes fluorescence polarization to quantify Fc-containing IgG. Probe molecules (V) rotate rapidly while unbound (top), while bound probe-IgG molecules rotate slowly (bottom).
To quantify the IgG concentration in a sample on the Cydem VT system, a protein standard curve must first be generated. Ideally, the source IgG used for the curve should be the same as the samples being tested. However, a generic calibrator can also be used because each clone will be compared to the reference standard curve. The system builds the standard curve by taking a known concentration of source IgG (provided by the user with an ideal concentration around 1100 mg/L) and performing a series of nine dilutions from 0 mg/L to 1100 mg/L. The fluorescence polarization is measured for each known concentration, and the resulting data is used to construct the standard curve. This curve is then utilized to determine the concentration of IgG in samples by measuring the fluorescence polarization value in the sample and translating it to the relative IgG concentration on the curve.
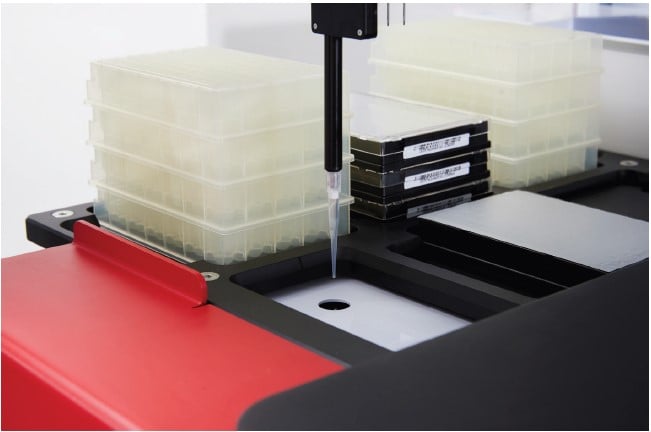
Figure 4. The liquid handler dispenses the sample into the Titer Module.
Dilutions
As the sample IgG concentration approaches the saturation point of the standard curve, a dilution will subsequently be performed to measure IgG concentrations beyond this point. The system initiates with no dilution of the sample and progresses to 2x, 5x, and 10x dilutions. If the system measures a concentration above 80% saturation of the standard curve within the current dilution range, it will automatically increase the dilution level for the next scheduled titer measurement. To ensure accurate and reliable measurements, it is advisable to run the first titer measurement before the concentration is expected to reach 80% of the protein maximum (see the following “Quality Criteria” section). Additionally, it is recommended to run daily titer sampling after this point, but the frequency can be adjusted based on the researcher's knowledge of their own clone productivity. This will help to prevent the sample from reaching the point of saturation on the standard curve and optimize the accuracy of the measurements. If the antibody concentration does exceed the upper limit of detection for the current dilution range, causing the measurement to be unreportable, the subsequent scheduled measurement will be automatically increased to the next dilution level in the series to accommodate for this. By tailoring the titer sampling frequency and timing to the specific clone and expected concentration range, researchers can obtain precise and meaningful data throughout the development process.
Quality Criteria
Generating a robust standard curve is crucial for obtaining accurate IgG values from samples. Ideally, the standard curve should begin to plateau around 1000-1100 mg/L, indicating that the probe is saturated with IgG and further binding is not possible. By reaching this saturation point near the end of the curve, the widest meaningful range of the standard curve is achieved.
The Cydem VT system standard curve incorporates three quality criteria to ensure continuous high quality titer measurements:
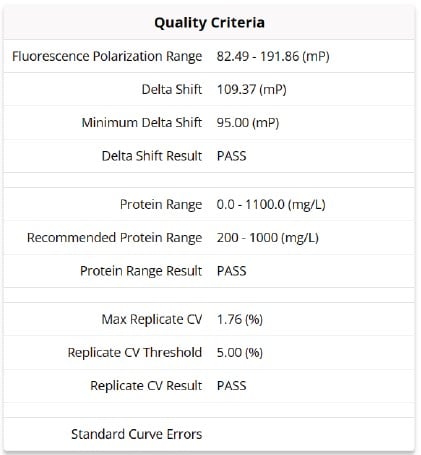
Figure 5. Display of the Cydem VT system standard curve quality criteria.
- Fluorescence Polarization Range (mP) - Functional FP Minimum and Functional FP Maximum
- Delta Shift is calculated by subtracting the minimum functional fluorescence polarization (FP Min, measured in mP) value from the maximum functional fluorescence polarization (FP Max, measured in mP) value.
- FP Min: The point on the curve below which the system cannot detect a discernable difference in fluorescence polarization.
- FP Max: The point on the curve above which the system cannot detect a discernable difference in fluorescence polarization.
- To ensure the most reliable measurements, it is crucial to have a Delta Shift value greater
than 95 mP.
- A larger Delta Shift value is desirable as it provides a wider range between the FP Max and FP Min values. This increased range enhances the differentiation in results, leading to more accurate and meaningful data interpretation.
- Protein Range (mg/L) – Protein Minimum and Protein Maximum
- Protein Minimum: The relative IgG concentration at the FP Min point, below which the system cannot accurately quantify IgG. This point should ideally be below 300 mg/L to meet system specifications.
- Protein Maximum: The relative IgG concentration at the FP Max point, above which the system cannot accurately quantify IgG. This point should ideally be above 1000 mg/L to meet system recommendations, but this value may vary by individual isotype binding affinity.
- The Protein Max on the standard curve is translated to the maximum IgG value able to be measured with a 10x dilution (the Protein Max value multiplied by 10).
- If the chosen antibody has a high binding affinity for the probe, there is a possibility that the standard curve will saturate before reaching 1000 mg/L. In such cases, the system will be able to measure up to 10 times the Protein Max value. For example, if the Protein Max is 950 mg/L, the system can quantify IgG up to 9500 mg/L or 9.5 g/L.
- Similarly, if the chosen antibody for the standard curve has a concentration below 1000 mg/L, the system will only be able to quantify up to 10 times the starting concentration of IgG. For instance, if the starting concentration is of IgG is 950 mg/L, the system can measure IgG up to 9500 mg/L or 9.5 g/L.
- Max Replicate CV (%)
- Each point on the standard curve is measured in triplicates.
- The maximum coefficient of variation (CV) among triplicates of any concentration in the standard curve must be less than 5% to ensure the most accurate curve equation.
Adjustments to the standard curve
There are two primary adjustments that users can make to the standard curve: starting concentration of IgG and specimen volume.
- Starting Concentration
- The starting concentration defaults to the ideal input concentration of 1100 mg/L, and for best performance this value should be between 1000 mg/L and 1200 mg/L. However, the Cydem VT system allows adjustments to this concentration.
- This feature is useful when the starting concentration of IgG is below 1000 mg/L, making it challenging to reach that value through concentration methods. It can also be utilized if the starting concentration was measured on an offline device and determined to be a value different from 1100 mg/L.
- Since the system uses fixed volumes to create the dilution series for the standard curve, adjusting the starting concentration will automatically modify the generated concentration values.
- For example, in Table 1 (below), an IgG4 lambda with a concentration of 1090 mg/L was used as the source IgG (undiluted), and the starting concentration was adjusted to 1090 mg/L so that the corresponding standard curve would be generated accordingly.
- Specimen Volume
- The specimen volume defaults to 10 μL but can be adjusted within the range of 8 μL to 14 μL.
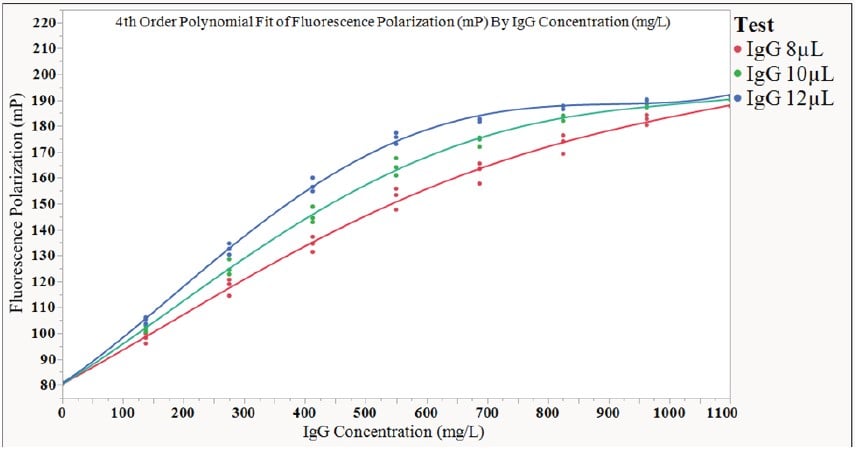
- This adjustment is useful, for instance, when the subclass binding affinity alters the ideal standard curve. By modifying the specimen volume, the most suitable standard curve can be achieved based on the quality criteria. The specimen volume that gives the greatest IgG functional range and delta shift values should be used. The effect of this adjustment can be observed in Figure 6 (below).
The effect of varying specimen volume was tested by creating a 1500 μL stock solution of Beckman Coulter Human IgG Standard at a concentration of 1100 mg/L. Three standard curves were generated on the same Cydem VT system using this IgG stock solution, with the only differentiation between the curves being in the specimen volume (8 μL, 10 μL, and 12 μL). The following curves were generated as a result of this adjustment:
| 8 μL Specimen Volume | 10 μL Specimen Volume | 12 μL Specimen Volume | |||
|---|---|---|---|---|---|
| IgG Functional Range (mg/L) | Delta Shift (mP) | IgG Functional Range (mg/L) | Delta Shift (mP) | IgG Functional Range (mg/L) | Delta Shift (mP) |
| 1100 | 107.0 | 1100 | 109.88 | 835 | 107.12 |
Figure 6. Effects of specimen volume adjustment on the standard curve of the same starting IgG solution. The recommended specimen volume for this IgG is 10 μL, since it spans the full protein range from 0-1100 mg/L, and has the largest delta shift, giving the largest FP functional range.
To demonstrate the effect of subclass binding affinity on the standard curve, five different subclasses of human IgG were tested on the system. Each subclass was prepared at a concentration of 1100 mg/L following the Cydem VT system instructions for use (IFU). The specimen volumes were adjusted to create the optimal standard curve based on the quality criteria. The following subclasses were used:
| Manufacturer | IgG Type | Starting Concentration, diluted from stock (mg/L) | Recommended Specimen Volume (8 μL-14 μL) | IgG Functional Range (mg/L) | Delta Shift (mP) | IgG Maximum Measurable Concentration (g/L) |
|---|---|---|---|---|---|---|
| Beckman Coulter | Pooled Human IgG | 1100 | 10 μL | 1100 | 109.88 | 11 .00 |
| NIST | Humanized IgG1, κ | 1100 | 8 μL | 940 | 124.53 | 9.40 |
| Athens Research & Technology | Human IgG2, κ | 1100 | 8 μL | 995 | 105.00 | 9.95 |
| BioCell | Human IgG4, κ | 1100 | 8 μL | 1005 | 119.61 | 10.05 |
| Sigma Aldrich | Human IgG4, λ | 1090 (undiluted) | 14 μL | 1090 | 124.67 | 10.90 |
Table 1. List of IgG subclasses run on the Cydem VT system. Each was originally run with a specimen volume of 10 μL, evaluated against the quality criteria detailed above, then adjusted and rerun if needed to attain the largest Protein Range and Delta Shift.
The following standard curves were generated for each subclass in Table 1:
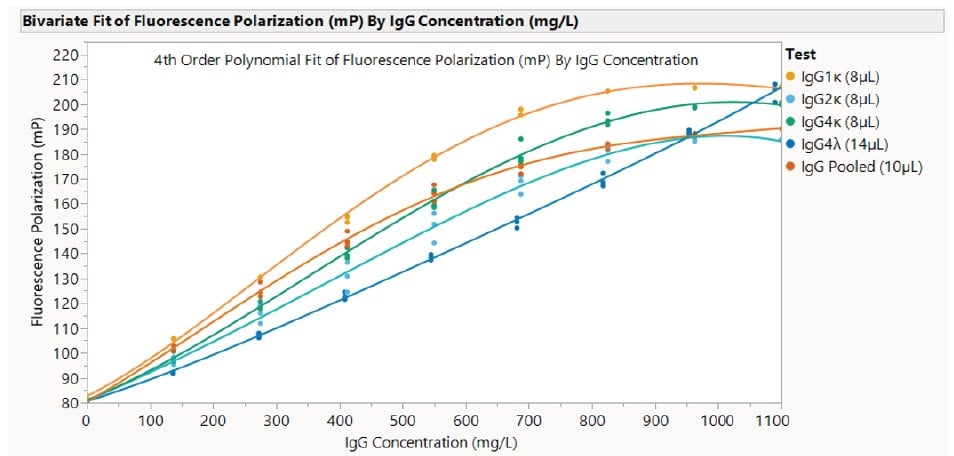
Figure 7. Demonstration of the standard curves generated for 5 different IgG types. The specimen volume was adjusted for each type to produce the optimal standard curve.
The Cydem VT Automated Clone Screening System provides a comprehensive and automated solution for generating an antibody standard curve. By accurately and frequently measuring mAb titer in the cell line development process, researchers can optimize data acquisition on clone productivity. The system's fluorescence polarization technology allows for precise quantification of IgG concentration, and the generation of a robust standard curve ensures accurate and meaningful data interpretation. Furthermore, the Cydem VT system incorporates three quality criteria to ensure continuous high-quality titer measurements. By meeting these criteria, researchers can assess the reliability and accuracy of the standard curve and the resulting data, enhancing the overall quality of their experiments. With the ability to easily tailor the standard curve based on specific IgG binding affinity and concentration, the Cydem VT system offers researchers a reliable and efficient tool for successful biologic drug development.


