Single Cell Sorting with CytoFLEX SRT Cell Sorter
Objectives
- Demonstrate how to set up a plate sort in CytExpert SRT software.
- Learn the difference between 0.5-drop and 1-drop envelope.
Introduction
A very useful utility of cell sorters is the capability to sort single cells into multiwell plate formats. The experiments are commonly referred to as “cloning” experiments, as they are often used to create clonal cell lines from the growth of a single cell into a colony. In recent years, advances in single cell genomics and transcriptomics have increased the use of single cell deposition experiments.
In a cell sorter like the CytoFLEX SRT, desired events are defined using either Boolean gate logic or Hierarchical gate regions on data analysis plots. When sorting into tubes, thousands of these events are typically deposited. For bulk sorts like this, where cells are collected into a single tube, sort logic is defined to achieve desired purity and maximize recovery of sorted cells. If an empty drop is sorted, or a contaminating (non-target) cell is sorted, the overall impact to sort outcome is low. This knowledge may lead to the selection of a more inclusive sort envelope and/or gating strategy. However, when sorting into a plate, an empty drop or contaminated drop has a much larger effect. Each well is effectively a unique sort. So, especially in the context of single cell genomic work, every empty well or contaminated well can be problematic. Deposition efficiency requirements should therefore be considered when setting up a plate sort. While it remains important to get all the cells that were targeted in the sort logic, some loss is anticipated. This loss becomes less tolerable the rarer the population becomes, or when depositing into plates. High plate deposition efficiency is desirable for many reasons, such as saving on plasticware by making every well count, as well as saving on the expense associated with reagents for single cell genomic work.
In this application note, focus will be placed on how to set up a single cell sorting experiment with a plate output, the use of the 0.5 drop and 1 drop envelopes, and the possible outcomes for experiments using these envelopes.
Setting up for a Single-cell Sort
Creating Regions, Gates and Sort Logic
All sorting experiments begin with analyzing sample data. In this case, the data is simple. HeLa cells transfected with GFP were harvested and a small amount was run on the CytoFLEX SRT.
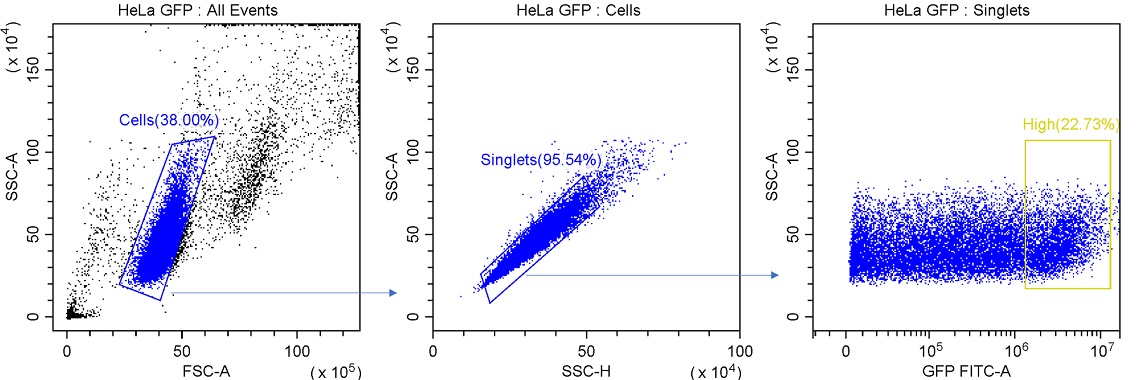
Figure 1. Example Gating for Single-cell Sorting. Cells are isolated from debris using a region gated on FSC x SSC plot. Singlet events are identified by linear relationship between SSC-H and SSC-A. Desired events are then identified based on expression levels.
For this experiment it is possible to get the events that are desired with 3 plots and 3 regions. In this experiment, the desired events are the top 20% GFP expressing cells. Three gates were used to ultimately define this population. First, cells are separated from debris by looking at FSC-A vs SSC-A. It may be necessary for different cell types to increase the gain for these channels to effectively resolve cells from small debris or dead cells.
For all sorting experiments it is important to exclude doublets (cells adhering to one another) from sort logic. There are several means to accomplish this and in this case a plot of SSC-A (area of the pulse measured) vs SSC-H (height of the pulse measured) is used. In this method, singlets will have a very tight association between these 2 parameters. Any doublets will have a similar Height signal, but due to the second event sticking to the first, they will have increased Area signal. In analysis experiments this prevents mistaking cell identity due to 2 cells being stuck together. In sorting, this prevents sorting an undesired cell stuck to a desired cell or sorting 2 cells where only 1 is required.
Finally, in this experiment, the decision was made to only sort the highest expressing GFP positive events. A region was drawn to include the top expressors of the fluorescent protein. Finally, the highest GFP expressing events were included in gate P3. Using gate statistics, the region was drawn to include the top 20% expressors of the fluorescent protein.
Setting up the Plate Sort
CytoFLEX SRT’s automated setup workflows have already done the work of finding stable droplet formation and drop delay. The user calibrates the plate positioning (for more information see the CytoFLEX SRT IFU, Chapter 5) prior to defining the logic and plate layout.
Create a new tube for your experiment and click the plate sorting icon, see figure 2.

Figure 2. Adding Tube to Experiment. The red outline identifies the Plate Sorting icon used to add tubes to the experiment file.
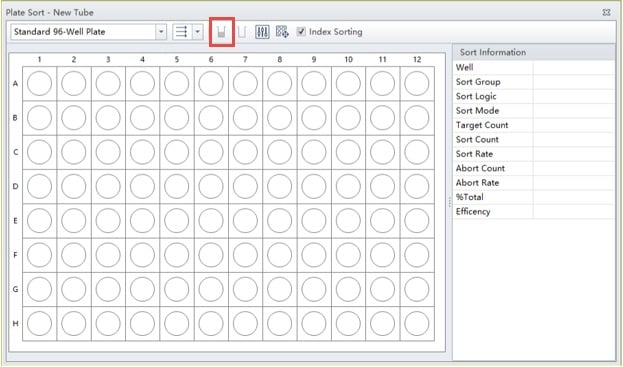
Figure 3. Blank Plate Layout. Outlined in red is the button used to define a well or series of wells as a sample well.
A blank plate layout will appear, figure 3. First, indicate what media (plate type) you are sorting into. Then indicate the direction you wish the plate to be filled, whether by rows from left to right, across rows, down columns, or serpentine across columns or rows.
Select all the wells you wish to have cells deposited into. In this case we have left the outer wells empty. This is often done in cell culture experiments as the outer wells can dry out quickly over long-term culture. Any wells can be left open or filled as the experiment requires.
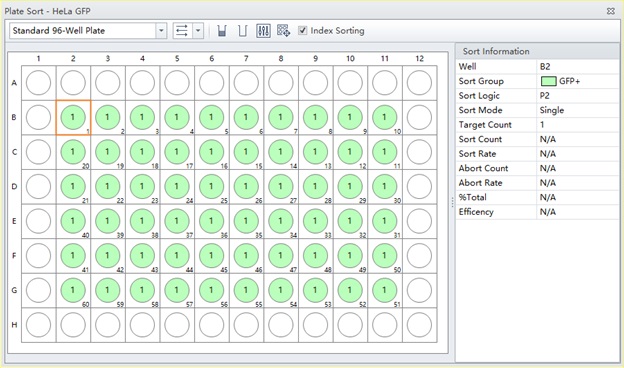
Figure 4. Completed Plate Layout. A plate layout showing wells assigned to be sorted, indicated in green.
Name the Sort Group (free text) and assign well color to the group. In this case, we named it “GFP+” and assigned it the color green, figure 4. Define the population to be sorted into the indicated wells by choosing from the hierarchical gate list, choosing “Single” Sort Mode and assigning the desired Target Count. Click OK to accept.
Once Start Sort is clicked, plate sorting begins. Multiple plates can be run with the same settings by choosing Duplicate tube without data and clicking Start Sort again. Additional populations can be sorted into empty wells by defining individual wells or groups of wells. However, only one gate can be assigned per well.
Sort Envelopes
When sorting into plates for single cell applications, an important consideration is the sort envelope size. The size of the sort envelope considers the position of the cell within the droplet when deciding whether to sort or abort the event, see figure 5. It asks, “Will the event remain in the desired drop, or will it move to the preceding or trailing droplet?”
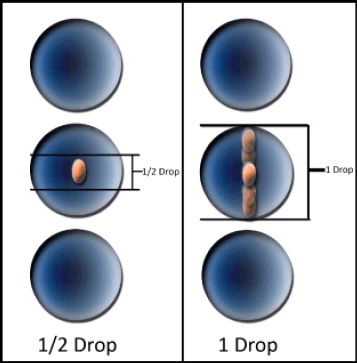
Figure 5. Drop Sort Envelope Illustration. An illustration of 0.5 drop and 1 drop sort envelopes. The cell cartoon indicates locations in the droplet that would be sorted in each envelope condition.
In the Sort Guard Illustration (figure 6), the effect of two envelopes used with Single sort mode are shown. A 1-drop envelope indicates that as long as the event of interest is predicted to be anywhere within the droplet and there are no contaminant cells in the leading and trailing edges of the drops above and below, the droplet will be sorted. However, before this event was in a droplet it was in the flow cell for interrogation and then in a laminar stream. As the interface between droplets narrows and droplets begin to break off, cells that are in the narrowing spaces might move into a trailing or preceding droplet, dependent upon their position in the stream, possibly resulting in sorting an empty droplet into a well if the event moves out of the charged droplet. If the target cell is not in the predicted drop, then sorting the empty drop results in an empty well. CytoFLEX SRT deals with this issue by using a Guard Band that will abort cells that have contaminants that are in the edges of neighboring drops.
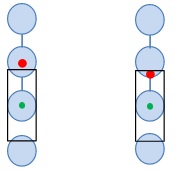
Figure 6. Sort Guard Band Illustration. The black rectangle indicates the 15% of a drop area in the leading and trailing drops that will cause aborts if a contaminant is likely to be present. The left event would be sorted, the right would be aborted.
In contrast, the 0.5 drop envelope addresses this issue by only sorting droplets where the cell of interest is predicted to be in the center 50% of the droplet. This lowers the chance of sorting an empty droplet into a well. The default sort envelope when using Single mode in the CytoFELX SRT is 0.5 drop.
In a plate sort, using a 1-drop envelope will have two likely outcomes. Abort rate will be lower and, thereby plates fill more quickly with less loss of target cells. Second, overall plate filling efficiency could drop as a result of some wells receiving empty droplets. Alternatively, when using the default 0.5-drop envelope the situation is reversed. Plates may fill more slowly, but overall plate filling efficiency is higher. Both plate efficiency and speed to fill the plate will also be affected by sample properties such as size of the cell, event rate of the sort, and target cell percentage.
Tips for Success
- It is important to calibrate the plate to ensure the stream hits the target, especially when adding a new sort media output.
- When filling the plate completely is most important, the default Single mode 0.5 drop envelope is recommended.
- Confirming plate calibration takes little time and can give reassurance that droplets will hit targeted wells.
- Plate efficiency can be measured in numerous ways such as PCR confirmation, multi-well plate imaging, or visual confirmation in a fluorescent microscope (shown below in Figure 6)).
- Be mindful of volume of both plate wells and droplets themselves in a low volume microplate. A cell that was sorted may land outside of collection media and desiccate. Also, sheath in the droplet is sorted along with the cell, so when sorting more than one cell per well in low volumes, the sheath contribution to overall volume could become an issue.
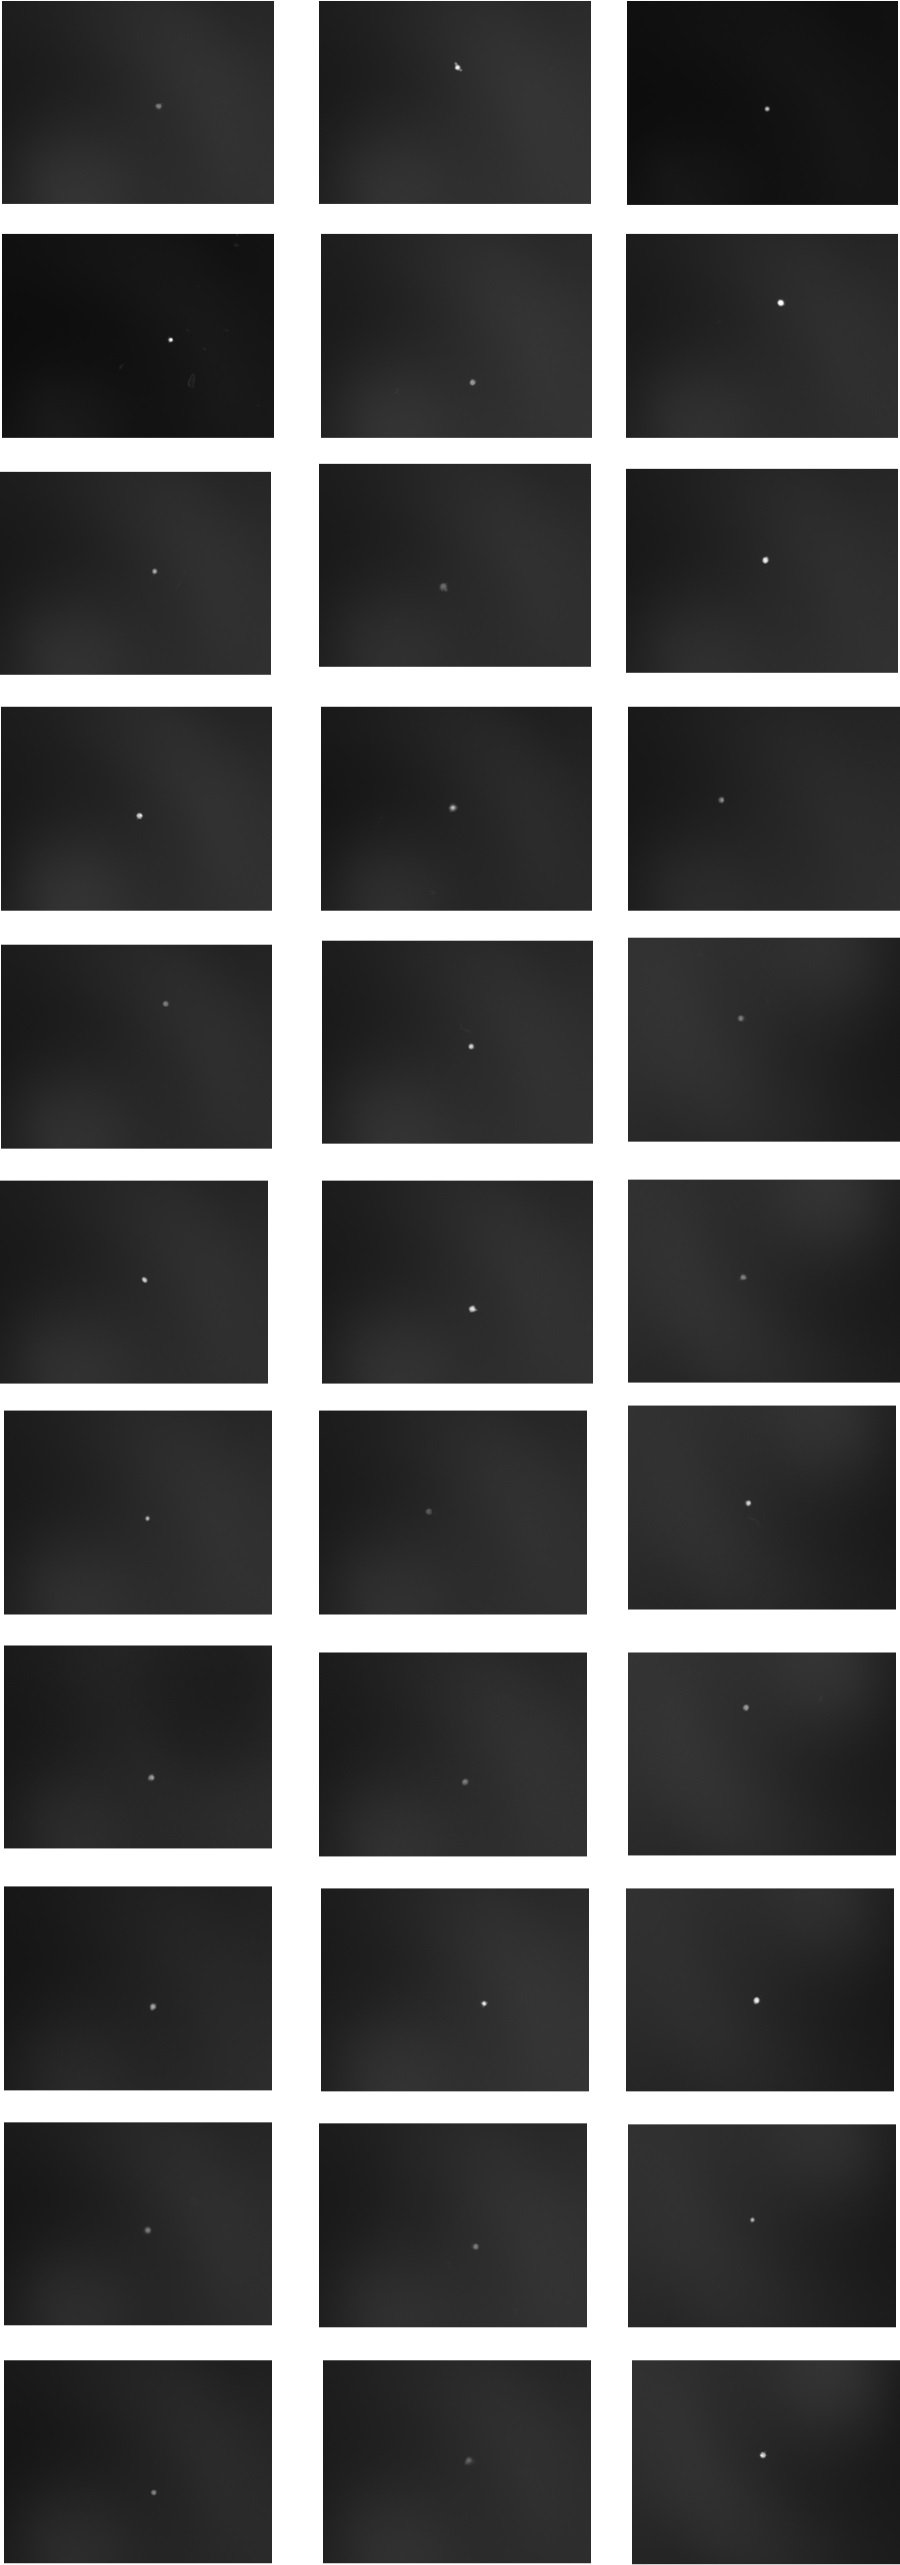
Figure 7. Single Cell Sort Performance. HeLa cells transfected with GFP were sorted with sort mode Single 0.5, filling the plate across rows in serpentine fashion. Sort collection was in small wells of media on a glass slide. After allowing the cells to settle, images were taken under low magnification to show singe cells in individual spots. Images represent 33 wells from 3 different experimental slides. 1 well per experiment had 10 cells/well (image not shown) to allow for focusing of microscope optics. Left column, experiment 1, center column experiment 2, right column experiment 3.
Summary
Single Sort mode on the CytoFLEX SRT allows researchers to have high level of confidence that cell count is accurate and plating efficiency is maximized. Multiple plate options exist up to 384-well format with straight down (uncharged droplet) sorting with options for Index Sorting data to be collected. Flexible options for how to fill the plate and what populations to place in the plate allow CytoFLEX SRT users to customize plate sorting conditions to meet the needs of their experimental systems.
For Research Use Only. Not for use in diagnostic procedures.

