Advanced Cell Cycle Analysis
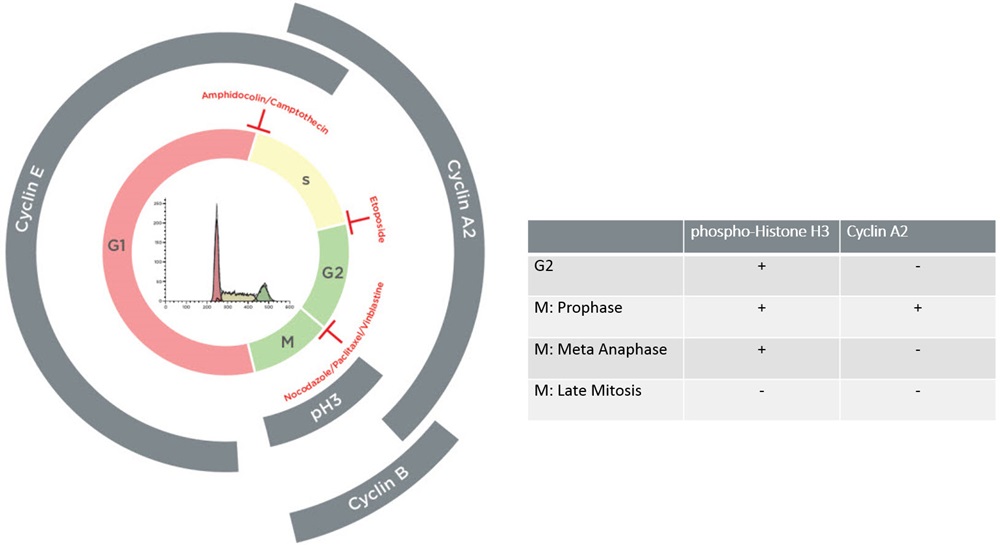
Using Flow cytometry to track the cell cycle is a quick method for studying the attributes of cell populations. The most commonly applied methods rely on the univariate analysis of cellular DNA content following staining with fluorescent DNA binding dyes. Among those dyes, Propidium Iodide and DAPI are commonly used for their ability to quantitatively bind to DNA; thus, the measurement of their fluorescence intensity allows the resolution of 3 major cell cycle phases, G0/G1, S and G2/M, which differ from each other by their DNA content. Because G2 and M Phase cells have the same DNA content, the univariate approach does not allow their separation. For this type of analysis, a more informative approach consists of a bivariate procedure using the measurement of both DNA content and the expression of proteins associated with various phases of the cell cycle using fluorescently labelled antibodies. Among others, the Cyclins, which have a discontinuous timing of expression throughout the cycle and Histone H3, which is differentially phosphorylated between mitosis and G2, constitutes suitable targets to identify with more granularity the various phases of the cell cycle. The combination of the DNA and protein measurements provides the means to separate cells into G2 and different M Phases.


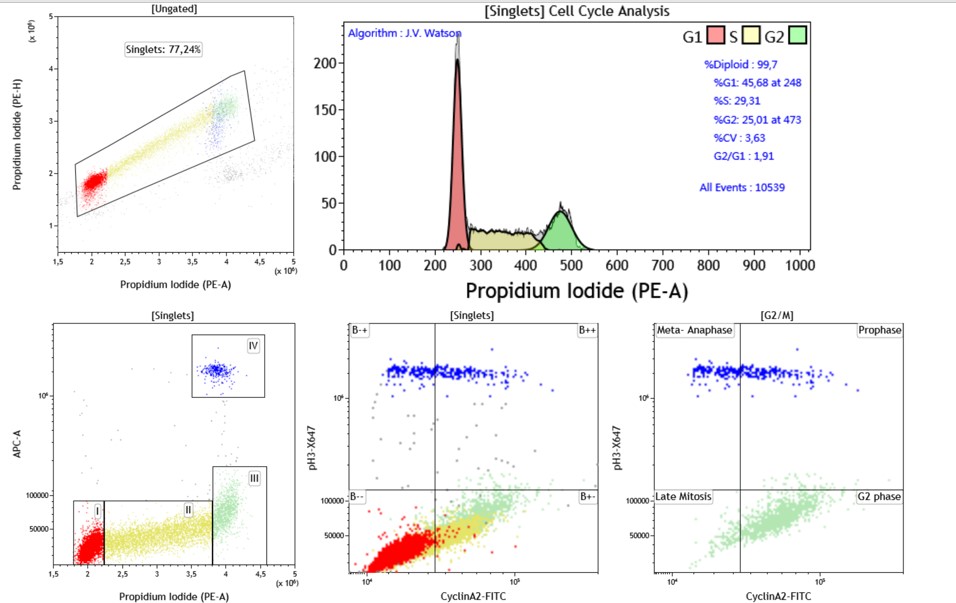
Advanced cell cycle Using Multivariate Analysis of Jurkat Cell Line.Untreated Jurkat cells were stained with Anti-Phospho-histone H3-Alexa647, Cyclin A2-FITC and cell cycle kit. (A) G1, S, G2 displayed according to the DNA staining (B) bi-variate analysis using DNA staining and pH3 staining shows separation between G1, S, G2 and M Phases (C) dual analysis of pH3 and Cyclin A2 expression provides the means to distinguish cells in M Phase. (D) Plot is gated on G2/M defined using Boolean gate comprising cells in Gate III and IV from figure B. Cyclin A2 by pH3 allows separation of the cells into G2, Prophase, Metaphase/Anaphase and Late Mitosis.

