CytoFLEX Platform Gain Independent Compensation Enables New Workflows
Objectives
- See example data showing different compensation workflow scenarios
- Understand the role of detector adjustments on the compensation spillover values
- Learn about CytExpert software automatic compensation algorithm and Gain Independent Compensation
INTRODUCTION
In flow cytometry, we use fluorochromes to label markers of interest on cells. These fluorochromes emit light (fluorescence) in a spectrum. Some of the fluorescence will be collected in the detection channel of interest, but some of the fluorescence will overlap with other channels.
Compensation is the process that we use to remove the unwanted light signals from all detectors except the one devoted to that fluorochrome. It is a mathematic procedure based on a fundamental constant proportional relationship between the two signals, Figure 1.
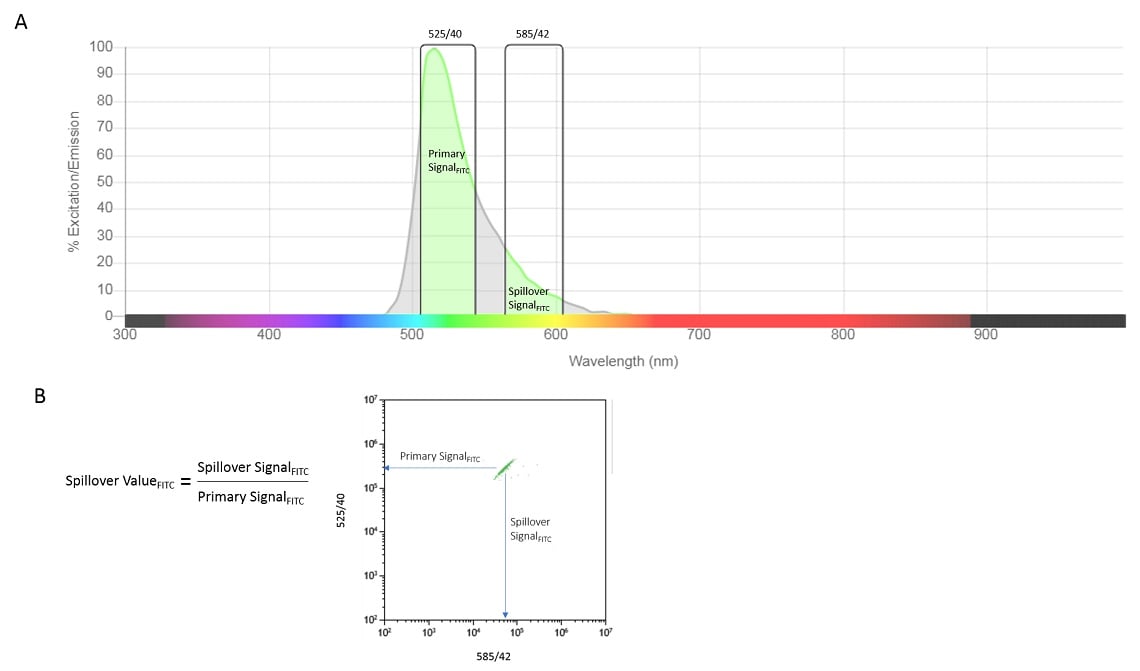
Figure 1. Proportionality of Signals. For a given cytometer configuration, “spillover” can be observed where signal from a fluorochrome will be captured in channels other than the designated channel used to measure it. The spectrograph shows the theoretical emission characteristics of FITC into two detection channels, 525/40 (primary channel) and 585/42 (spillover), panel A. The bivariate plot shows observed spillover using FITC beads acquired on the CytoFLEX V-B-R Flow Cytometer without spectral compensation, panel B. The equation shows the constant relationship between the Primary signal and Spillover Signal.
However, it may be desirable or necessary to adjust the measurement of one or more of the signals. This is accomplished by adjusting the voltage, or gain, of the photon detector. This adjustment will affect all light collected into that detector including the signal of interest as well as any spillover values. Figure 2 illustrates the result on the spillover values for the case where the signal sensitivity is increased in the PE channel.
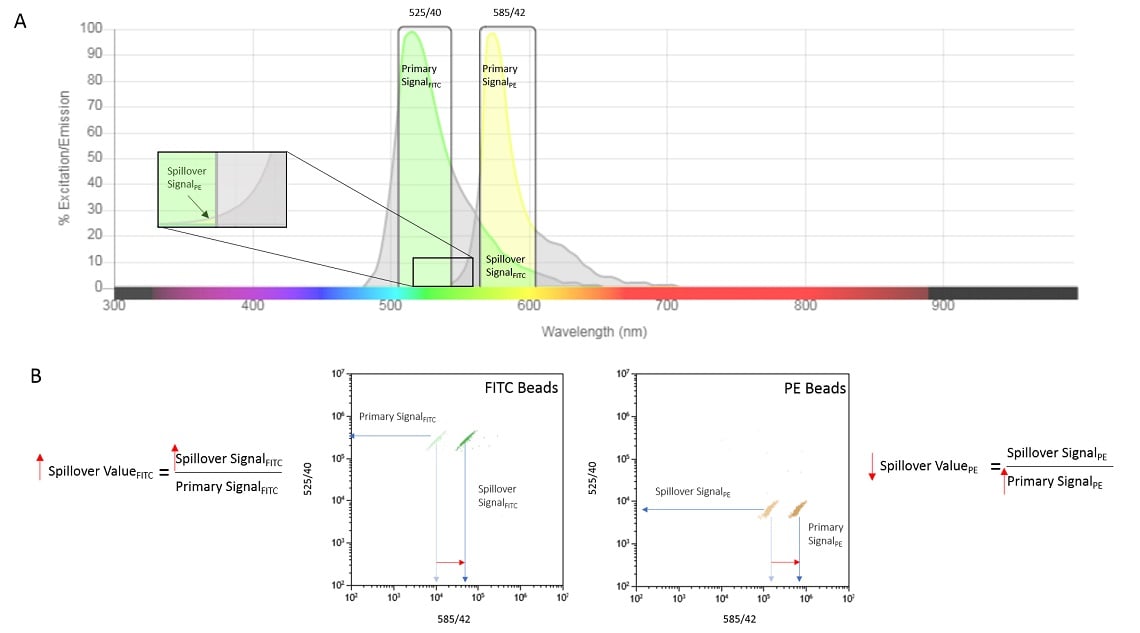
Figure 2. Increasing Detector Amplification. Increasing the gain on the 585/42 detector will amplify the Primary PE signal and the Spillover Signal due to FITC (panel A). The bivariate plots show detection of either FITC beads or PE beads under initial conditions and after amplification, panel B. Red arrows show the effect on both signal (bivariate plots) and the spillover equations.
The fluorescence emission from each fluorochrome can be measured in all detector channels and can be used for compensation. The acquisition software contains an algorithm that uses the single-color measurements along with the relationship to calculate spillover using matrix algebra to simultaneously solves for the spectral overlap of each fluorochrome into every detector and generates a compensation matrix. In traditional flow cytometers, the voltage for all of the detectors must be set and fixed during the collection of the single-color compensation controls and the samples. This satisfies the constant condition requirement for retaining the proportionality of signals in the spillover equation. However, the CytExpert software compensation workflow can circumvent the requirement for constant gain settings. We call this Gain Independent Compensation.
GAIN INDEPENDENT COMPENSATION FUNCTION
Due to the reproducible semiconductor manufacturing process, the gains of the detectors used in the CytoFLEX platform can be calibrated for a linear response. Measured intensities are linear to the detector gain setting across a wide range of gain settings. This means the fluorescence measurement increases or decreases linearly based on the gain adjustment. (Each instrument has its own gain/fluorescence curve for each detector). As a result, CytExpert software can calculate the changes in spillover based on the changes in gain settings. This means that a compensation matrix obtained at one gain setting can be used for experiments with different gain settings. CytExpert software leverages this in the software to provide users with Gain Independent Compensation. In a CytExpert compensation matrix, the gain value is recorded along with the spillover values. When the gain is adjusted during the experiment, the compensation matrix is updated to reflect the change in the spillover values. See figure 3 for options available in CytExpert software.
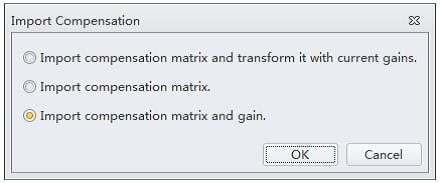
Figure 3. CytExpert Import Compensation Dialogue Box. When importing a compensation matrix into an experiment, CytExpert software provides three options. Import compensation matrix and transform it with the current gains readjusts the compensation using the gains from the experiment, Import compensation matrix, uses the values from the matrix without consideration of the gains, and Import compensation matrix and gain transforms the experimental gain settings with the values stored with the compensation matrix.
In order to demonstrate the Gain Independent Compensation function, we compare the results from different scenarios in figure 3. The test is performed at two different gains settings, see Table 1. We generated a compensation matrix at both gain settings. We then imported the compensation matrix obtained at the Gain Setting 2 and adjusted the matrix with Gain Setting 1 used for the sample acquisition. All four scenarios are compared, see Figures 5 – 8 for dot plots, table 2 and 3 for comparison of the compensation matrix, and Table 4 for a summary of population statistics across all scenarios.
It is important to note that all of the scenarios adhered to compensation best practices. These include having the measured signals of the single-color controls being as bright or brighter than the sample being analyzed, the fluorochromes used exactly matching the reagents used in the panel, the positive and negative populations having the same background autofluorescence and collecting enough events to ensure statistically significant values. In addition, the panel used in the study adhered to panel design best practices.
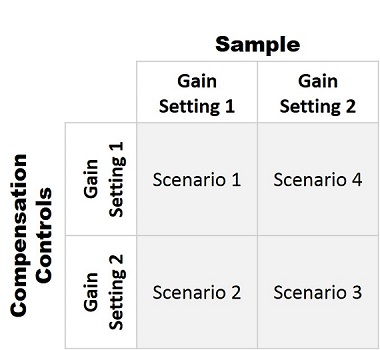
Figure 4. Scenarios used to demonstrate properties of Gain Independent Compensation. Scenario 1 uses Gain setting 1 to collect both the single-color compensation controls and the mixed stain sample. Scenario 2 uses a compensation matrix collected at a lower gain setting (gain setting 2) to compensate the data from the sample acquisition at gain setting 1 to test the ability of that compensation matrix to properly compensate the mixed stain sample. Scenario 3 uses gain setting 2 to collect the single-color controls and the mixed stain sample. Scenario 4 uses the compensation matrix collected at the gain setting 1 to compensate the sample collected with gain setting 2 from Scenario 3 to determine if the data can be properly compensated. The arrows indicate the direction of the gain transformations.
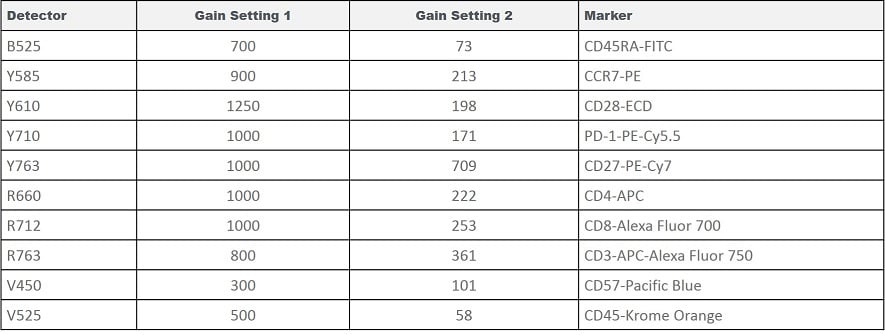
Table 1. Gain Settings Used in the Testing Scenarios.
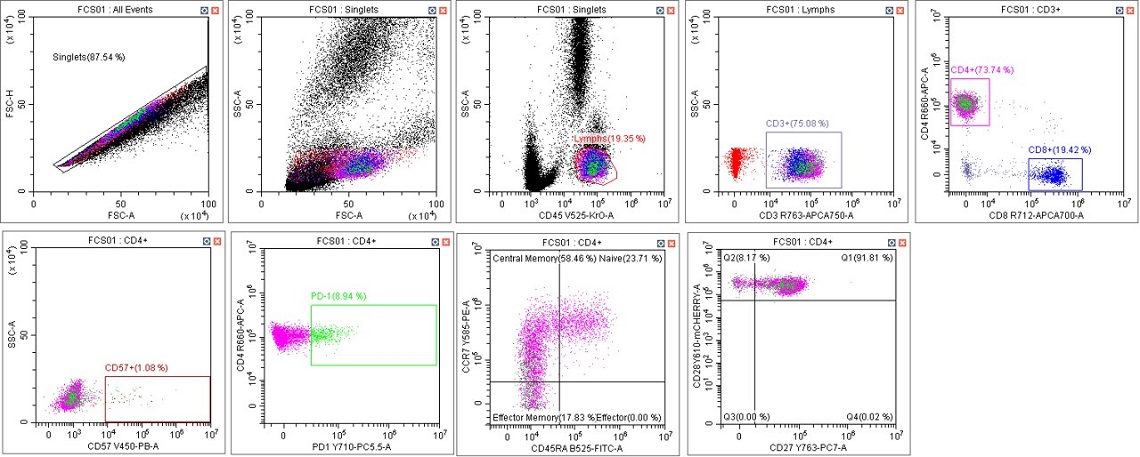
Figure 5. Immunophenotyping Population Analysis in Scenario 1. Human blood from a healthy donor was stained with DURAClone IM T Cell Subsets Antibody Panel (Part Number B53328), red cells were lysed with VersaLyse Solution (Part Number A09777) and data was acquired on a CytoFLEX LX U-V-B-Y-R-I Flow Cytometer using Gain Setting 1 for both single color compensation tubes and for the mixed stain sample. Data was analyzed in CytExpert Software. Briefly, the automatic compensation was used to compensate the data, data scaling was adjusted, and gates placed following the DURAClone IM T Cell subsets instructions for use.
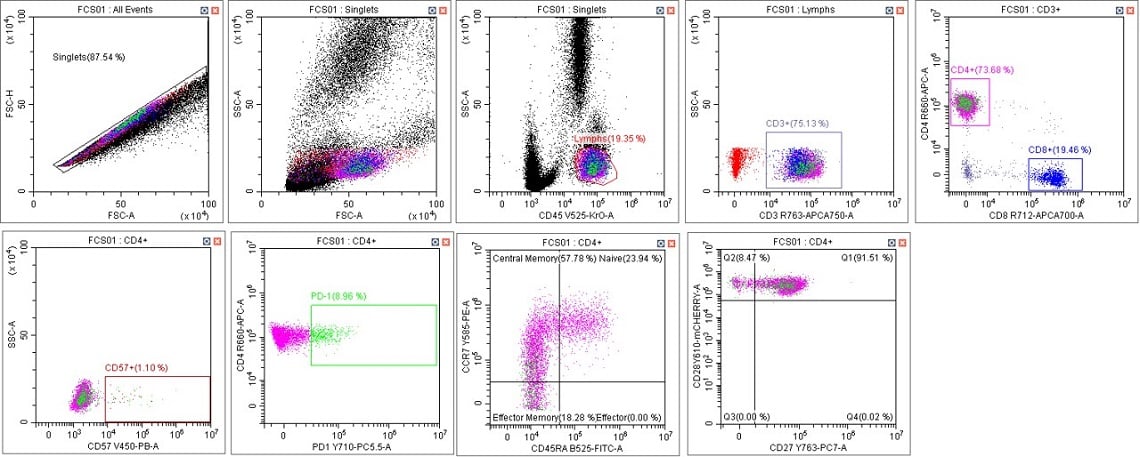
Figure 6. Immunophenotyping Population Analysis in Scenario 2. Human blood from a healthy donor was stained with DURAClone IM T Cell Subsets Antibody Panel (Part Number B53328), red cells were lysed with VersaLyse Solution (Part Number A09777) and data was acquired on a CytoFLEX LX U-V-B-Y-R-I Flow Cytometer using Gain Setting 2 for single color compensation tubes and Gain Setting 1 for the mixed stain sample. Data was analyzed in CytExpert Software. Briefly, the automatic compensation was used to compensate the data, data scaling was adjusted, and gates placed following the DURAClone IM T Cell subsets instructions for use.

Table 2. Comparison of Compensation Matrices for Scenario 1 and 2. Variances at absolute value of 0.5 are indicated with highlighting.
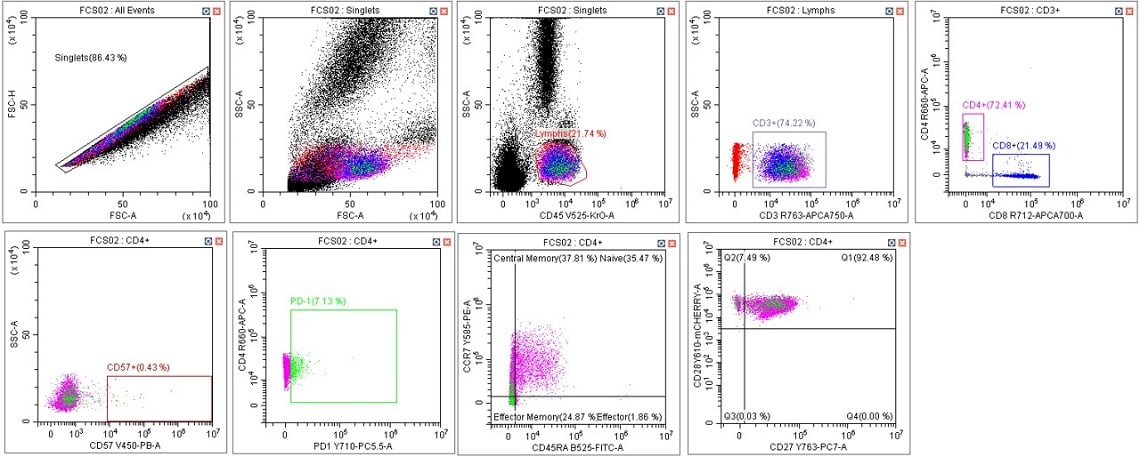
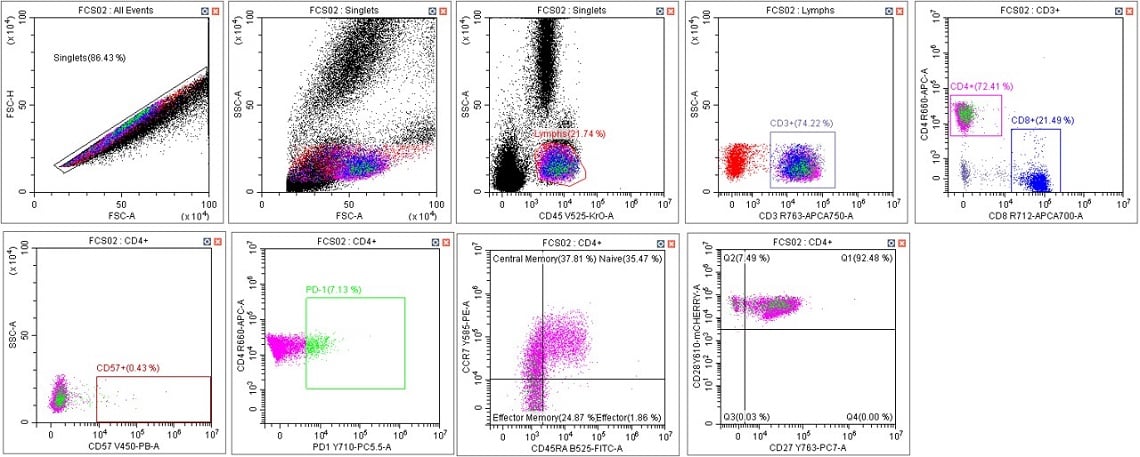
Figure 7. Immunophenotyping Population Analysis in Scenario 3. Human blood from a healthy donor was stained with DURAClone IM T Cell Subsets Antibody Panel (Part Number B53328), red cells were lysed with VersaLyse Solution (Part Number A09777) and data was acquired on a CytoFLEX LX U-V-B-Y-R-I Flow Cytometer using Gain Setting 2 for both single color compensation tubes and for the mixed stain sample. Data was analyzed in CytExpert Software. Briefly, the automatic compensation was used to compensate the data and the template from scenario 1 was applied (keeping the data scaling and gate placement consistent) panel A. Data scaling and gate placement was optimized manually in panel B following the DURAClone IM T Cell subsets instructions for use.

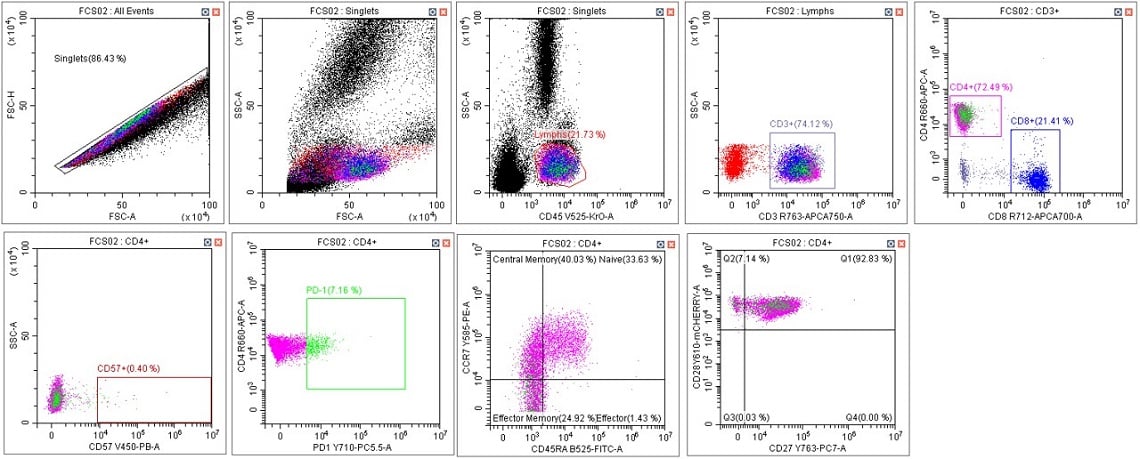
Figure 8. Immunophenotyping Population Analysis in Scenario 4. Human blood from a healthy donor was stained with DURAClone IM T Cell Subsets Antibody Panel (Part Number B53328), red cells were lysed with VersaLyse Solution (Part Number A09777) and data was acquired on a CytoFLEX LX U-V-B-Y-R-I Flow Cytometer using Gain Setting 1 for single color compensation tubes and Gain Setting 2 for the mixed stain sample. Data was analyzed in CytExpert Software. Briefly, the automatic compensation was used to compensate the data and the template from scenario 1 was applied (keeping the data scaling and gate placement consistent), panel A. Data scaling and gate placement was optimized manually in panel B following the DURAClone IM T Cell subsets instructions for use.
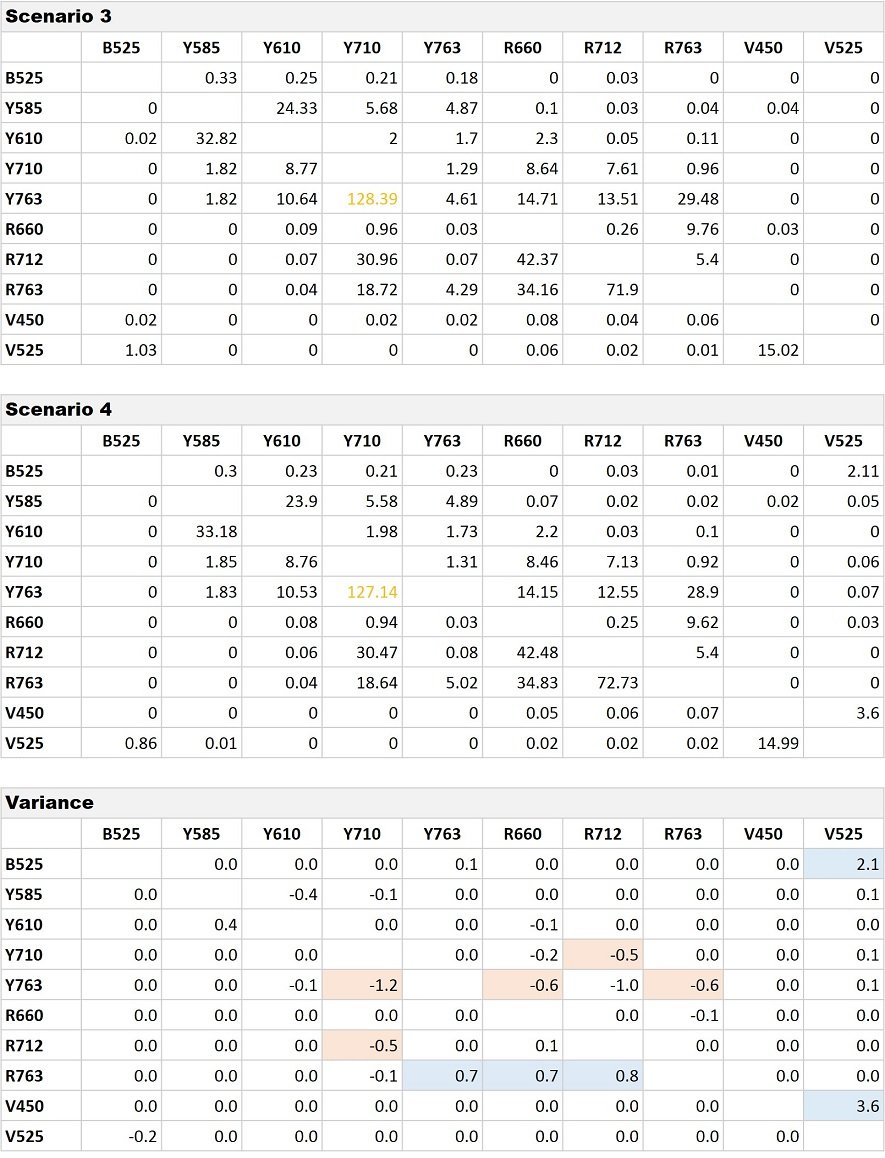
Table 3. Comparison of Compensation Matrices for Scenario 3 and 4. Variances at absolute value of 0.5 are indicated with highlighting.
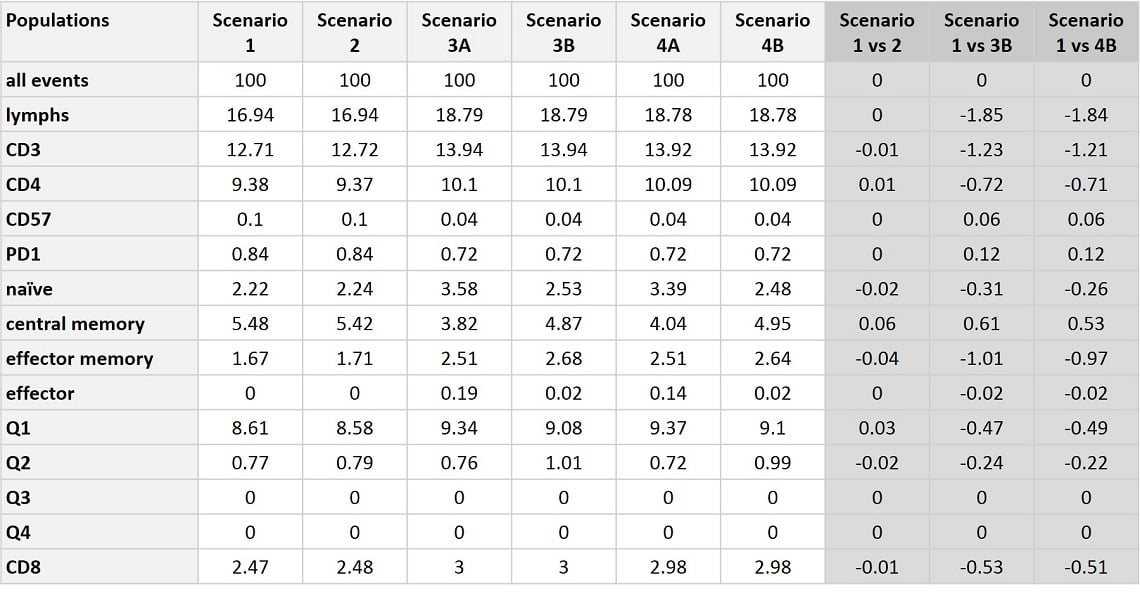
Table 4. Summary of Population Statistics across all Compensation Scenarios. Percent positive for each identified population, up to all events is presented across all scenarios. Scenario 3A and 4A show the percent positive as assessed by gates placed according to scenario 1 data, while in Scenario 3B and 4B the data scaling and gate placement was manually corrected post compensation for the given dataset. The variance compared to Scenario 1 is calculated for each population and is below 2% over all populations and for most populations the variance is less than 1%.
In summary, population statistics are consistent across samples that were collected at the same gain setting, regardless of the settings used for the single-color compensation controls. Compare statistics from Scenario 1 and 2 collected at Gain Setting 1 (optimal) and Scenario 3 and 4 collected at Gain Setting 2 (QC Recommended). Across every condition tested the overall variation is 0-1.85%, with the majority of assessed populations varying less than 1% different across all conditions. The data scaling and gate placement was most affected by the differences in gains used to acquire the sample. In these conditions certain populations were more sensitive to the gate placement, a subjective task. In these populations, that manual gate adjustment contributes to the variance. Even in these sensitive populations, such as naïve, central memory, and effector cells, the variance is under 2% across all conditions. In all conditions, Gain Independent Compensation was effective in preparing the data for analysis.
NEW EXPERIMENTAL WORKFLOWS
Gain Independent Compensation enables new efficient workflow for multicolor flow cytometry. While acquiring data, it may be necessary to optimize the gain settings. In CytExpert it is possible to adjust the gains and the compensation will automatically recalculate. In traditional flow cytometers if a PMT voltage needed to be adjusted to bring a sample signal on scale, for example, then the entire set of single-color compensation controls would need to be reacquired and a new compensation matrix prepared after the APD gain adjustment. In large panels and using a variety of sample treatment conditions, it may take an iterative process to ensure that all signals are optimized. Gain Independent Compensation increases the efficiency of this process.
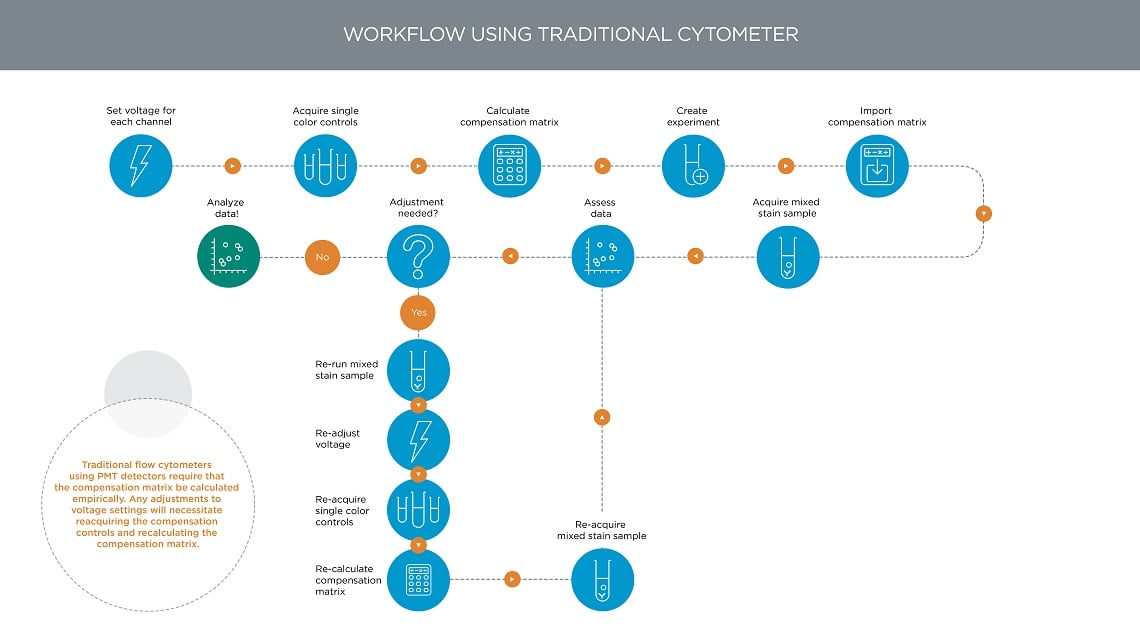
Figure 9. Multicolor Flow Cytometry Workflow in Traditional Flow Cytometers. Traditional flow cytometers using PMT detectors require that the compensation matrix be calculated empirically. Any adjustments to the voltage settings will necessitate reacquiring the compensation controls and recalculating the compensation matrix.
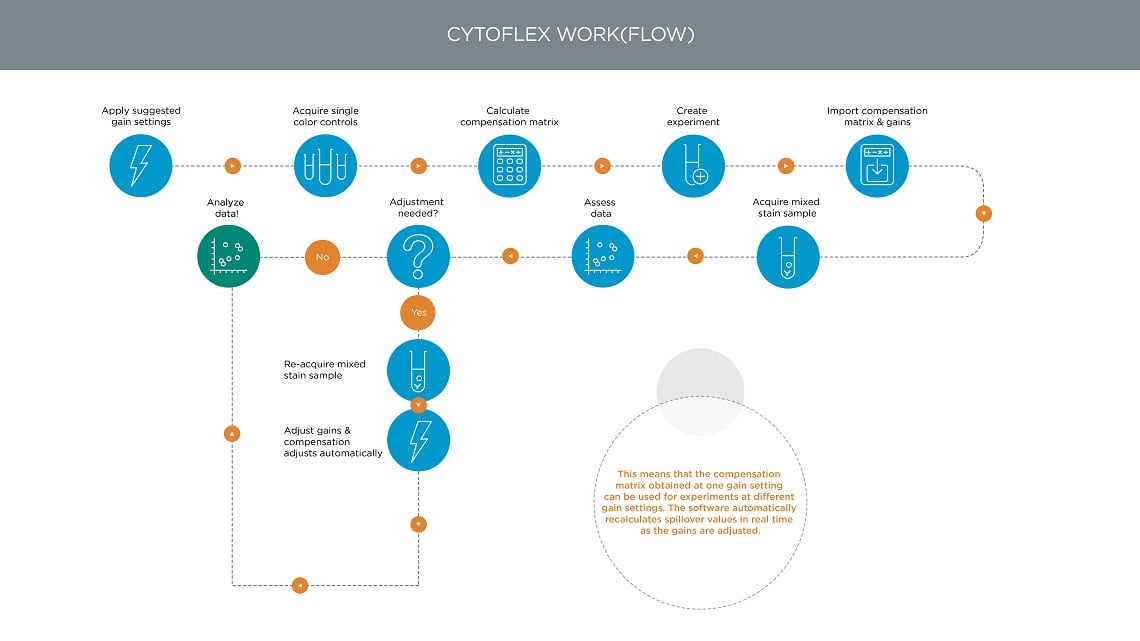
Figure 10. CytoFLEX Flow Cytometer Multicolor Workflow. In the CytoFLEX flow cytometer, the Gain Independent Compensation means that the compensation matrix obtained at one gain setting can be used for experiments at different gain settings. The software automatically recalculates spillover values in real time as the gains are adjusted.
GAIN ADJUSTMENT WHILE ACQUIRING SINGLE-COLOR CONTROLS: SPECIAL CASE
In order to implement Gain Independent Compensation, CytExpert software stores the gain settings with the compensation matrix and in the Compensation Library. The gain settings used during acquisition of the single-color tube selected, indicated by blue highlight (see figure 11) when the matrix is calculated are the gains that get stored. If the gain settings are adjusted while acquiring the single-color stains it will be important to ensure that the selected tube contains the desired gain settings when the Calculate Matrix function is executed, see Figure 10 for an example.
In this example, the QC recommended gains, see Table 1, were used at the beginning of the process. Gain settings were adjusted during the acquisition of the Y710 (from 171 to 1000) and the R763 (from 361 to 800) channels. The compensation matrix was calculated with either the first or the last tube selected. The resultant compensation matrix was then imported using the setting Import Compensation Matrix and Gain, Figure 10. To avoid unintended consequences, it is best practice to ensure that the last tube is selected before initiating a matrix calculation.
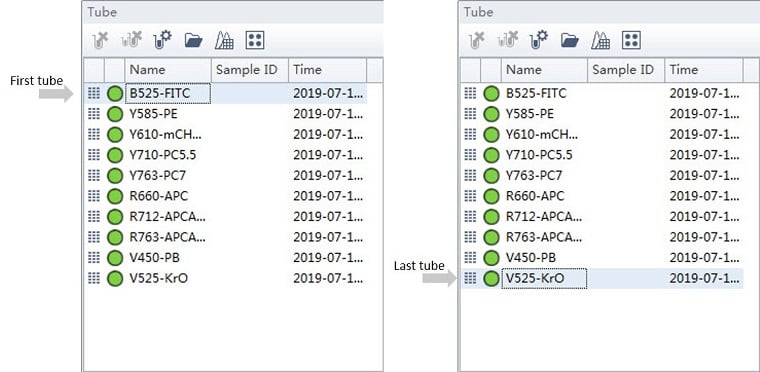
Figure 11. CytExpert Tube Panel. The panel indicates the status during acquisition. The tube that is selected is indicated with blue highlight. The gain settings from the selected tube will be used when creating and storing the compensation matrix.
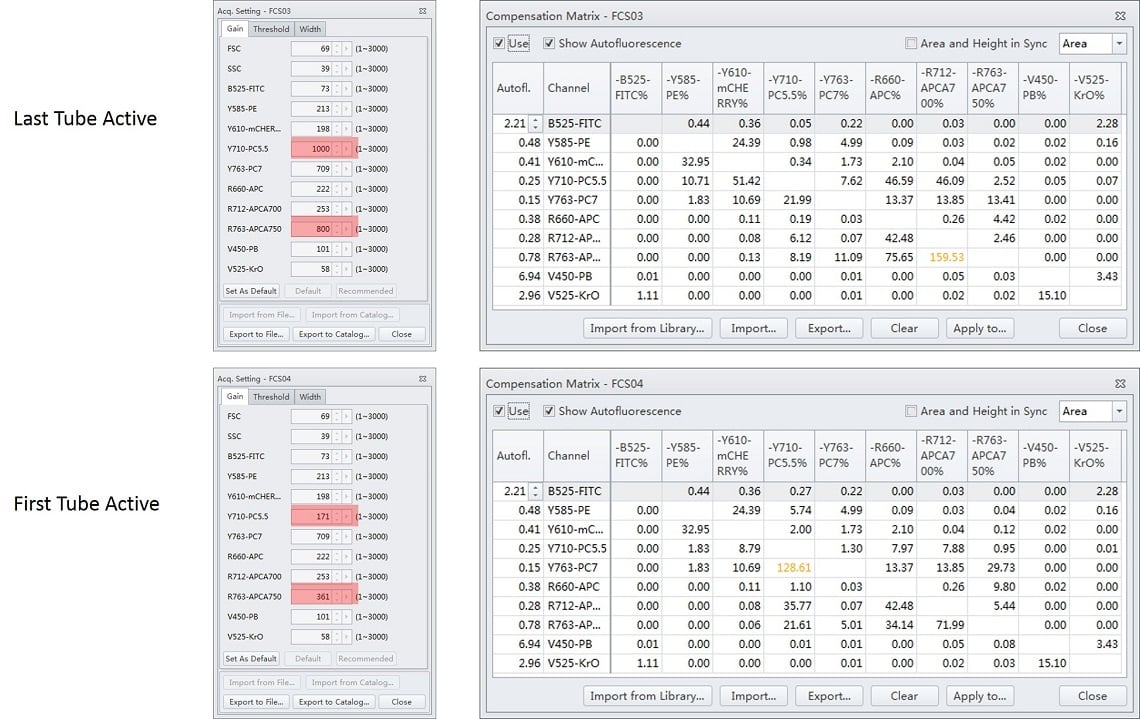
Figure 12. Importance of Tube Selected when Calculating Compensation Matrix. Gain settings were adjusted during the acquisition of the Y710 (from 171 to 1000) and the R763 (from 361 to 800) channels. The compensation matrix was calculated with either the last tube or the first tube selected. The resultant compensation matrix was then imported using the setting Import Compensation Matrix and Gain. Different results can be visualized when viewing the acquisition settings and resulting compensation matrix. When the last tube was selected at the time the function was invoked, all of the gain changes made were included in the file. When the first tube was selected, then the starting values, prior to any adjustments were stored.
CONCLUSION
We compared four different compensation scenarios using different gain settings for the compensation controls and the mixed stained sample, applying the CytExpert gain independent compensation algorithm. The resulting compensation matrices were compared demonstrating an absolute value of the variance between 0 and 3.6. These compensation matrices were used to deconvolute staining in a 10 color immunophenotyping panel. The resulting population percentages vary by less than 0.06%, scenario 1 vs 2. A larger factor in determining the population percentages is the gains applied to the sample acquisition, and not the gains used for the single-color controls.
Gain Independent Compensation enables new efficient workflow for multicolor flow cytometry. The CytExpert software compensation workflow can circumvent the requirement for constant gain settings. This allows user to adjust the measurement of one or more of the signals during the workflow without requiring them to reacquire the single-color controls. The software automatically recalculates spillover values in real time as the gains are adjusted.
For Research Use Only. Not for use in diagnostic procedures.

