Coulter Principle Short Course - Chapter 1
Basic Concepts in Particle Characterization
1. Particles
What is a particle? According to Webster’s Dictionary, a particle is “a minute quantity or fragment” or “a relatively small or the smallest discrete portion or amount of something.” Because the word “small” is relative to “something,” a particle can be as small as a quark or as large as the sun. In the vast universe, the sun is just a small particle! Thus, the range of sciences and technologies for studying particles can be as broad as we can imagine, from astrophysics to nuclear physics. Therefore, we have to define the type of particles in which we are interested.
“Fine Particles” is a term normally reserved for particles ranging from a few nanometers to a few millimeters in diameter. Particles may exist in various different forms. These forms span biological macromolecules and polymers—which can exist as linear chains and networks, including proteins, hydrogels, DNA chains, latexes, etc. Particles can also include ensembles of small inorganic, metallic, or organic molecules—or in some cases, even pieces of empty space such as microbubbles. The most common form of particles, however, are miniscule pieces of bulk materials, such as metal oxides, sugar, pharmaceutical powders, paint, or even the non-dairy creamer used to make coffee taste delicious.
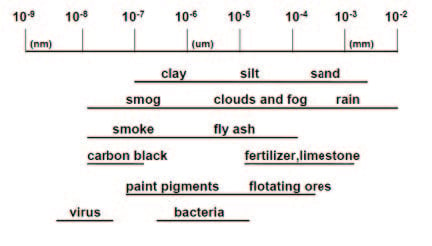
Particle Characterization and Counting is mainly concerned with studying particles in the size range shown in Figure 1.1. Within this size range, there are two properties that can distinguish particles from bulk materials:
- In a system, there exist a high number of particles. Each individual particle may have different physical or chemical properties if the material is not homogeneous. The ensemble behavior is usually what is macroscopically observable. The macroscopic properties are derived from contributions of individual particles. If the relevant property is the same for all particles in the system, the system is deemed “monodisperse.” If all or some of the particles in the system have differing values for the property of interest, the system is referred to as “polydisperse.” Another term, “pausidisperse” is occasionally used to describe systems with a small number of distinct groups. All particles within a given group have the same value for the concerned property.
- The specific surface area (surface area per unit mass) of small particles is so high that it leads to many significant and unique interfacial phenomena, such as surface interaction with the surrounding medium and neighboring particles. For example, a spherical particle with a density of 2 g/cm3 will have a specific surface area of 3 cm2 /g when the diameter is one cm. The specific surface area increases to 3,000,000 cm2 /g if the diameter is reduced to 10 nm. This example illustrates how a particle’s dimension determines the surface area, which in turn determines the thermodynamics and kinetic stability of a given particulate system.
The aforementioned surface property is especially unique for colloidal particles. The word colloid was coined by Thomas Graham in 1861 from Greek roots meaning ‘glue-like’, based on his observation that glue molecules do not pass through a parchment membrane. Thus, colloid science is based on the size of the colloidal unit. Many physical properties besides the one observed
by Graham are shown by colloidal systems, that by definition, include systems with at least one dimension less than a micron in size. Generally speaking, colloidal particles have dimensions from 10-9 m to 10-6 m.
2. Particles and Our Society
In the above matrix, colloidal suspensions, aerosols and emulsions are prevalent in many fields and have the largest application in industry or academia. The following is just a short list of fields involved with particulate systems:
- Abrasives
- Beer Industry
- Biomedical
- Biotechnology
- Cell Biology
- Chemical Mechanical Planarization
- Chromatographic Material
- Clays
- Cosmetics
- Cryobiology
- Crystals
- Electronic Industry
- Emulsion
- Environmental
- Filtration and Filter Efficiency
- Fish Farming
- Food Industry
- Fuel
- Hydraulic Fluids
- Lubricants
- Marine Biology
- Medical Imaging
- Metals
- Nanotechnology
- Paints and Pigments
- Paper Industry
- Pesticides
- Petrochemical Industry
- Pharmaceuticals
- Photo Industry
- Oils
- Toners
- Water Contamination
Particle technologies are deeply embedded in our society. Not only are they used as analytical tools in many industries for quality and process control, but they are also extremely useful in some not so obvious areas, like the environmental industry for waste disposal, pollution prevention and emission monitoring. New industries, like biotechnology, are increasingly using particle characterization analyses in both research and production processes.
3. Characterization of Particulate Systems
One focus area in particle science and technology is the characterization of particles’ size and concentration. The behavior of a particulate system and many of its physical parameters are highly dependent on the size and number of particles present in the system.
Out of necessity, there are many techniques used in particle characterization, especially since the sizes (from nanometers to millimeters) and shapes (from solid spheres to porous flat plates) are extremely broad. Prior to modern particle characterization technologies, the only evaluation methods available were physical separation methods such as sieving, which can only be used for particles larger than a few tens of microns. Additionally, classical separation methods are usually only able to bin particles into several sizes; this results in very low resolution. Optical microscopy may be the only exception to this since it is a method that provides visual observation of individual particles with dimensions down to the micron range. With optical microscopy though, a few dozen observed particles are tenuously used to extrapolate the properties of billions to trillions of particles in solution. Today, many new, sophisticated technologies are available that may be employed in particle characterization.
4. How We Define the Size of a Particle
For a 3D nonspherical or non-cubic particle, we will need more than one parameter to describe its dimension. The question is: “Can we choose just a few dimensional numbers to describe a particle?” The answer is “yes” for objects with regular shapes such as rectangles (two- or three-dimensional numbers) or a cylinder (two-dimensional numbers). However, for irregularly shaped particles that are often encountered in the real world, the dimensions cannot be completely described using just a few parameters. If we are dealing with just a few particles, then it might be possible —although difficult— to obtain all the numbers necessary to characterize the dimensions of the particles. When talking about millions of particles though, the ability to describe them individually is not practical. Only one number should be used to characterize each particle, and this number is size. The definition we employ to define size will affect the sizing data we obtain. One may assume that there is only one way to define size; in fact, there are many different definitions for using a single size to describe 3D irregularly shaped particles. The most common size definition is to use an equivalent spherical representation—since a sphere is a 3D object requiring only one number (diameter) to completely describe the size. If all the dimensional information of the particle is condensed into a single number, one must keep in mind that this single number will inherently contain distorted or summarized information about the particle, with the degree of distortion being related to the particle’s shape. There are many different methods for converting the size of 3D irregularly shaped particles into equivalent spheres. To follow are just a few definitions that often appear in the literature:

In addition, there are:
- Sphere of same maximum length
- Sphere of same minimum length
- Sphere of same weight
- Sphere of same volume (Heywood diameter)
- Sphere of same surface area
- Sphere of same sieve aperture
- Sphere of same sedimentation rate
The volume equivalent sphere (the Heywood diameter) is the one used in most . One important thing to understand is that the method used to measure 3D irregularly shaped particles will affect the results when reporting on an equivalent spherical diameter. The spherical diameter distribution or the average diameter obtained using different technologies will have different bias and deviation from the actual, true equivalent diameters of the particles, because of both shape sensitivity of the technology and weighting effect for different particles in the sample. One technique may see more of the large particles while another technique may see more of the small particles. Which result is right?
5. Which Technology Produces the Correct Results?
The nature of each particle characterization technique will determine how they “see” the same system, with different views for different techniques. In the language of statistics, different techniques see particles with different “weighting factors.” The mean value obtained from summarizing discrete individual values represents the relationship between the measured signal and the particle.
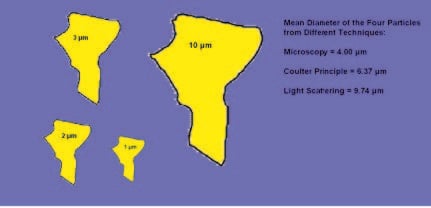
It is very important to discuss what the differences are when using different technologies to obtain particle size. If we use an electron microscope to measure particles, we will measure the diameters, add them up, and divide by the number of particles to get a mean result. If we then use laser diffraction to obtain the particle size, we will see that the area of particles is what is most important, and the size mean data will be generated from multiple diffraction patterns of many particles at the same time. In the Coulter Principle (also known as the Electric Sensing Zone Method) measurement, we would get the volume of each individual particle and then the result reported as the Heywood diameter. Let us assume that there is a particle system that consists of four spherical particles with the diameters being 1, 2, 3 and 10 microns, respectively. The corresponding mean values from the various sizing techniques are shown in Table 1.2 and Figure 1.3.
| Method | Mean Diameter (µm) |
| Electron Microscopy | 4 |
| Coulter Principle |
6.37 |
| Laser Diffraction |
9.74 |
Table 1.2. Various Particle Sizing Techniques.
We can see from the previous table that the mean value can be quite different if we use different technologies. The difference between number-averaged value and weight-averaged value is due to the fact that in the number average, the mean value represents the values from particles with the largest population. In the weight-average case, the mean value skews the representation toward the particles with the largest size. The same is true for the size distribution. Thus, we see that the number distribution and the weight distribution do not necessarily agree.
Because of resolution limitation or practicality in actual measurements, the measured particle sizes are always classified into discrete channels (also called bins). Each channel covers a range of particle size. For example, if an instrument has 100 channels, and channels 10, 11, and 12 are marked 5 microns, 10 microns, and 15 microns respectively, then the particles classified into channel 11 will have diameters ranging from 7.5 to 12.5 microns. Even though the results may be presented as a continuous distribution curve, at a zoomed-in level, the results are a histogram with each channel centered at a nominal value with the high and low edges located in the middle of its nominal value and its neighboring channels’ nominal values.
From the above analysis, we know that in order to compare the results, the distribution obtained from different technologies must be converted to the same ground, i.e., the same weighting. However, this conversion is based on an assumption that the technologies in question have the same sensitivity over the entire size range. Otherwise, the results will still be different even after conversion. For example, in laser diffraction measurements, the scattered intensity from large particles will be buried into the experimental noise and undetectable if the measurement is performed at large scattering angles; while in measurements relying on the Coulter Principle, the signals from small particles will be below the noise level if a large aperture is used. No matter what type of conversion is performed, the results from the two measurements will never be matched because there is different bias in the two technologies. One has to keep in mind that during the data transformation, the experimental error is also transformed. If in an electron microscopy measurement, there exists a ±3% error on the mean diameter, the error on the converted mass will be cubed and become ±27%! Contrastingly, if a ±3% uncertainty exists in a mass-based measurement, the uncertainty in the size would be only ±1.5%. Another often-used conversion is from mass % to volume % or vice versa. In this conversion, if all particles have the same density, then the two distributions will have the same profile.
6. Data Interpretation
Many times there is confusion with the interpretation of the statistical data of a size distribution. The values for the mean, median and mode in many cases will be completely different depending upon which distribution one observes (volume or number). The question arises: “Why does this happen?” Which one is the correct one? It turns out either can be correct, depending on which kind of data offers the most relevant information for the given situation.
Suppose we have 200 ball bearings, 20 marbles, and 2 golf balls. If counted, the total number is 222. This means that the ball bearings are 90% of the total population, the marbles 9%, and the golf balls just 1%. But if we want to know the contribution in volume to the total, we have to measure the volume of all the different balls in the sample. In this case, the ball bearings contribute 25% to the total volume, the marbles 25%, and the golf balls 50% (see Figure 1.4).
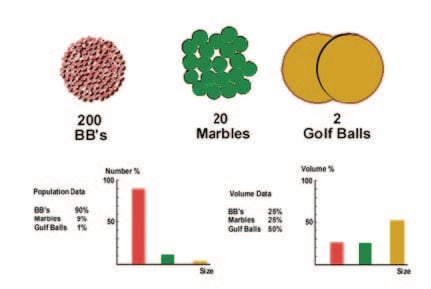
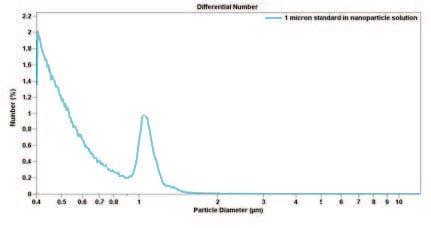
When we look at the number size distribution graph, we are looking to the population of the particles. In general, most powder grinds have more fines than large pieces and thus the graph will have a tendency to shift toward the lower-end of the distribution (see Figure 1.5).
In a volume size distribution graph, since the larger particles have the most volume displacement, the curve will be skewed toward the larger sizes (see Figure 1.6).
