Biomek i7 Hybrid Automated KAPA mRNA HyperPrep Workflow
Introduction
The KAPA mRNA HyperPrep Kit allows users to prepare stranded mRNA-Seq libraries compatible with Illumina® sequencing platforms from intact total RNA (50 ng – 1 μg). This kit enriches for mRNA in samples over other non-polyadenylated species (such as ribosomal, precursor, and noncoding RNAs) by using mRNA capture beads prior to library preparation with the KAPA RNA HyperPrep kit. The KAPA mRNA HyperPrep protocol is applicable to a wide range of RNA-Seq applications including: gene expression, single nucleotide variation (SNV) discovery, splice junction and gene fusion identification, and characterization of polyadenylated RNAs. The KAPA mRNA HyperPrep kit is compatible with dual or single-indexing strategies and can process up to 96 samples.
In comparison to manual pipetting, automation of the KAPA mRNA HyperPrep kit on Biomek platforms provides:
- Reduced hands-on time and increased throughput
- Minimized potential pipetting errors
- Standardized workflow for more consistent results
- Quick implementation with ready-to-install methods
- Knowledgeable support from Roche Sequencing and Life Science Support & Applications Team
In this flyer, the automated performance of the KAPA mRNA HyperPrep kit on the Biomek i7 Hybrid Genomics Workstation is demonstrated through successful library preparation and sequencing.
Spotlight
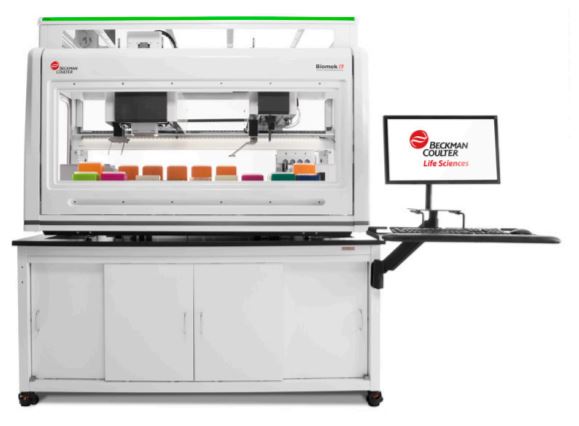
Biomek i7 Dual Hybrid (Multichannel 96, Span-8) Genomics Workstation
System features deliver reliability and efficiency to increase user confidence and walk-away time. Features of the Biomek i7 used to demonstrate this method include:.
*Replaceable with a second static peltier if desired. Thermally controlled shaking is not required for this automation method.
Automated Method
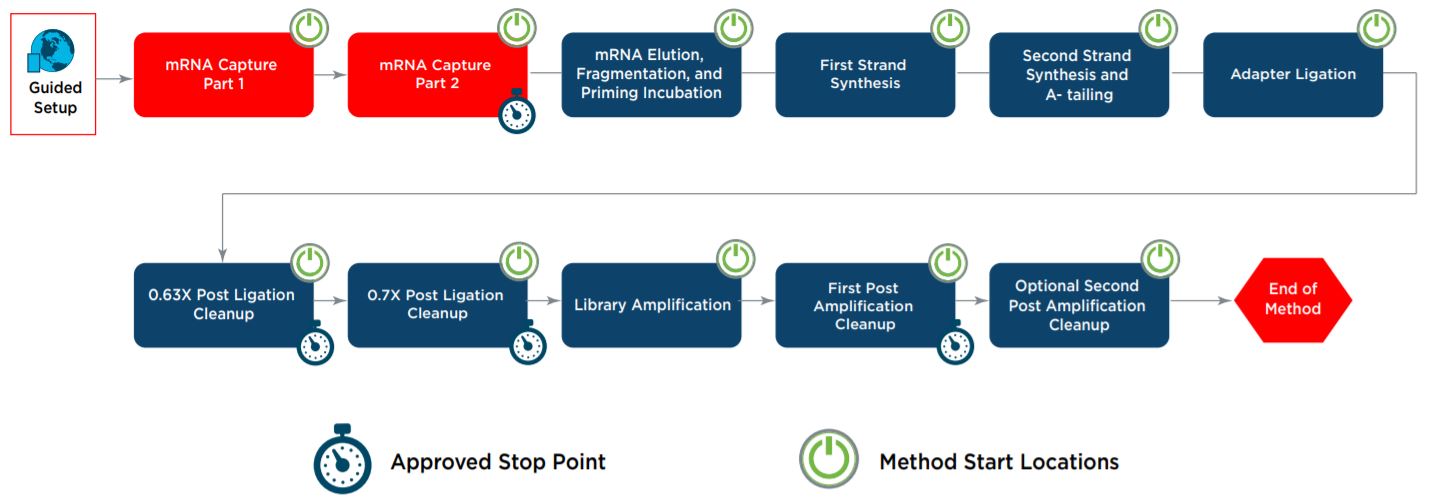
Figure 1. KAPA mRNA HyperPrep automated method workflow on the Biomek i7 Hybrid Genomics Workstation
Automation provides increased efficiency by reducing hands-on time (Table 1). The complete method (Figure 1) can be run with full walk-away capability but does include logical start and stop points assigned based on the KAPA mRNA HyperPrep Technical Data Sheet. Approved stop points provide users flexibility in workflow scheduling, allowing laboratories to address their individual requirements for sample processing and throughput. Each section of the workflow shown above with a Method Start Location icon can serve as a place to begin for error-recovery purposes. The automated method also offers additional workflow options based on Roche’s recommendations, allowing users to select a secondary post-amplification cleanup.
| Metric | KAPA mRNA HyperPrep Complete Workflow | KAPA mRNA Capture Only | KAPA RNA HyperPrep Only |
| Sample Throughput | 96 | 96 | 96 |
| Hands-On Time | 1 hr | 45 min | 45 min |
| Biomek Run Time | 6 hr, 11 min | 1 hr, 19 min | 4 hr, 55 min |
| Total Run Time | 7 hr, 11 min | 2 hr, 4 min | 5 hr, 40 min |
| Number of User Interactions (aside from initial setup) | 0 | 0 | 0 |
Table 1. Estimated run times for the KAPA mRNA HyperPrep kit on the Biomek i7 Hybrid Genomics Workstation. Timing estimates are based on the standard workflow as outlined in the KAPA mRNA HyperPrep Technical Data Sheet with 14 cycles of library amplification and a single post-amplification cleanup.
The KAPA mRNA HyperPrep automated method for the Biomek i7 Hybrid Genomics Workstation offers several user-friendly software features to guide the user through the setup process including:
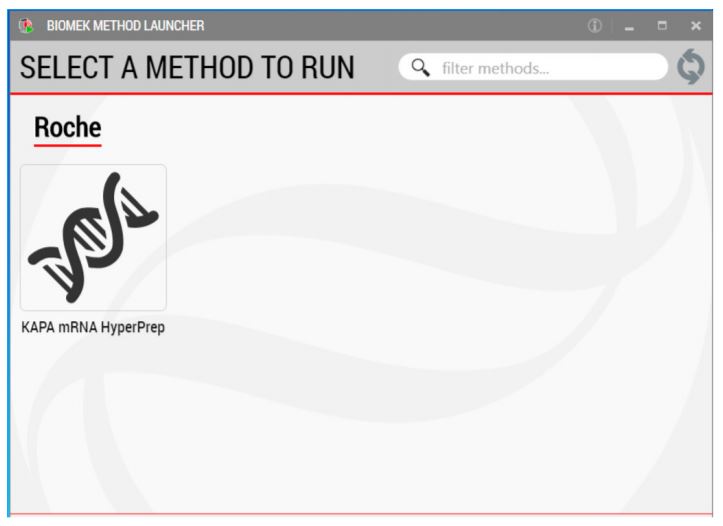
1. Biomek Method Launcher (BML)
BML is a secure interface for method implementation without affecting method integrity. It allows users to remotely monitor the progress of the run. The manual control options provide the opportunity to interact with the instrument, if needed.
Figure 2. Biomek Method Launcher provides an easy interface to launch the method.
2. Method Options Selector (MOS)
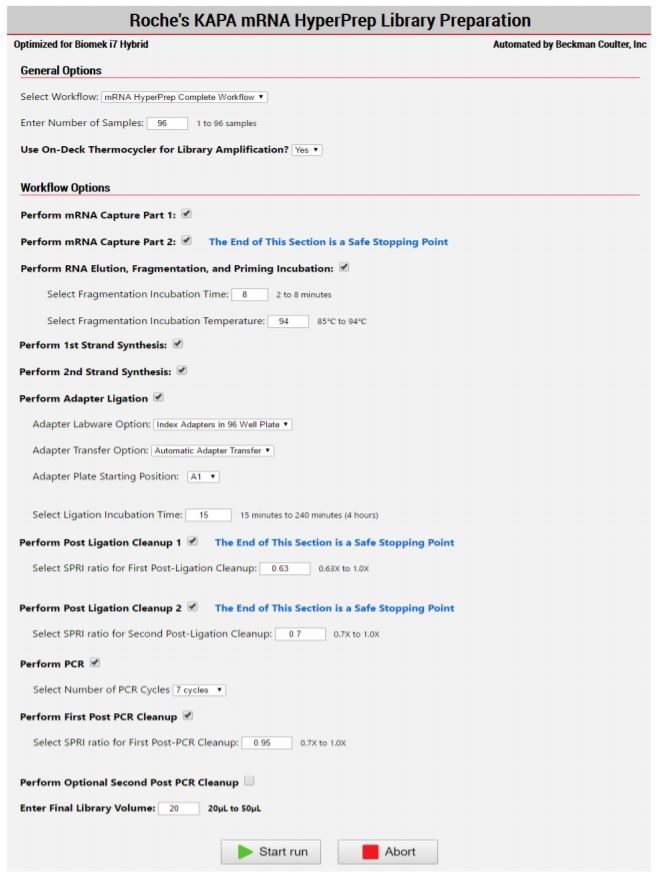
The MOS enables selection of workflow and sample number options to maximize flexibility, adaptability and the ease of method execution.
Figure 3. The KAPA mRNA HyperPrep MOS enables users to select the desired workflow, sample number, and a variety of workflow customization options.
3. Guided Labware Setup (GLS)
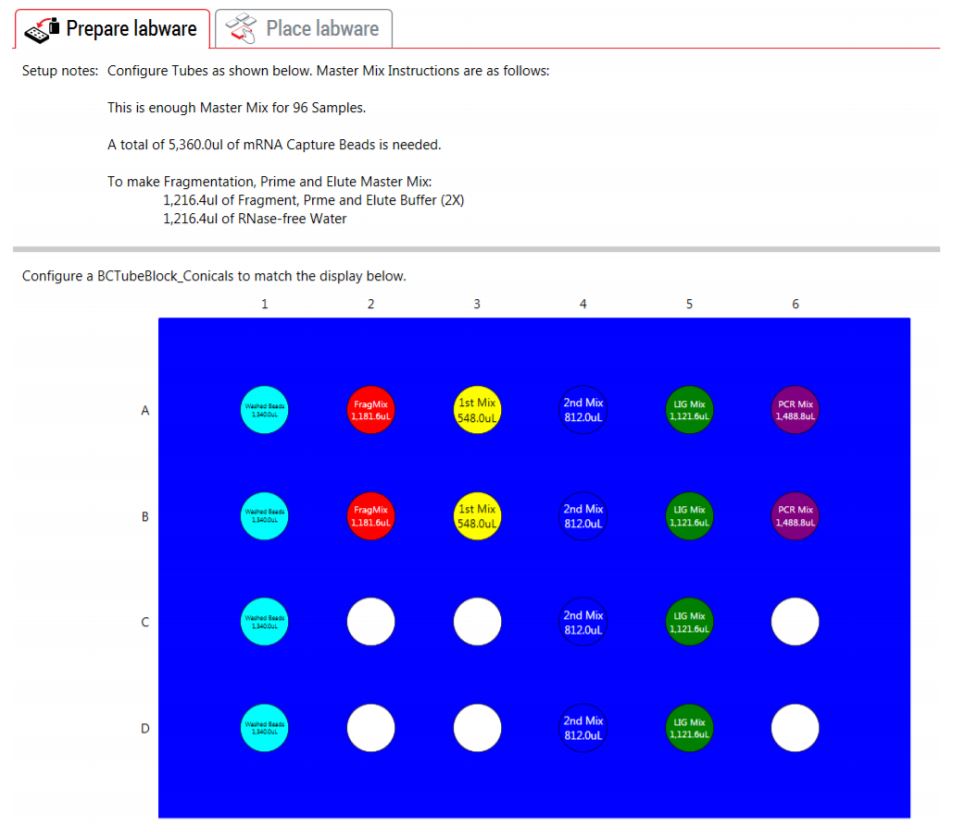
The GLS is generated based on options selected in the MOS, and provides the user specific graphical setup instructions with reagent volume calculation and step-by-step instructions to prepare reagents.
Figure 4. The GLS indicates reagent volumes and guides the user for correct deck setup
Experimental Design
In Experiment 1, InvitrogenTM Universal Human Reference (UHR) RNA was used as the input sample for a KAPA mRNA HyperPrep run of eight samples, testing the lower limits of the workflow. Four 50 ng replicates, and four 100 ng replicates were created, along with a set of manually prepared libraries for comparison. Input samples were checked for their quality using the Agilent 2100 Bioanalyzer with the RNA 6000 Nano assay and showed RNA Integrity Numbers (RIN) of 9. Total RNA was enriched for mRNA using the KAPA mRNA Capture kit proceeding into the KAPA RNA HyperPrep kit. Enriched mRNA samples were fragmented for 8 minutes at 94°C. All samples were adapter ligated with KAPA Unique Dual-Indexed (UDI) adapters at 1.5 μM concentration. Library amplification was performed on all samples for a total of 14 cycles. The manual libraries were prepared according to Roche specifications as noted in the KAPA mRNA HyperPrep Technical Data Sheet, while the automated libraries deviated from the standard workflow slightly, using a more stringent post-amplification cleanup (0.95X SPRI ratio). For libraries produced on the Biomek i7, all incubations and library amplification were performed on-deck using the Life Technologies Automated ThermoCycler (ATC). Final library size distributions were assayed on the Agilent 2100 Bioanalyzer using the High Sensitivity DNA assay. Post-amplification yields were assessed using the KAPA Library Quantification Kit. Two library replicates of each condition were selected for sequencing on the Illumina® NextSeqTM 550 System. A 2 x 75 bp paired-end run was performed using the High Output flow cell and raw reads were down-sampled to 6 million per sample after sequencing.
In Experiment 2, a full 96-well plate was processed to assay for the presence of plate effects. A single RNA input amount was used (250 ng UHR RNA). All library preparation and automation conditions were kept consistent with Experiment 1, with the exception of the number of library amplification cycles being decreased to a total of 12 cycles and the use of an off-deck thermal cycler. Final library yields for all 96 samples were measured using the QubitTM dsDNA HS assay. Library size distribution was assessed for a subset of libraries (Figure 5) using the High Sensitivity DNA assay on the Agilent 2100 Bioanalyzer.
Figure 5. Visual representation of which libraries were selected for sizing assessment.
Experimental Results and Discussion
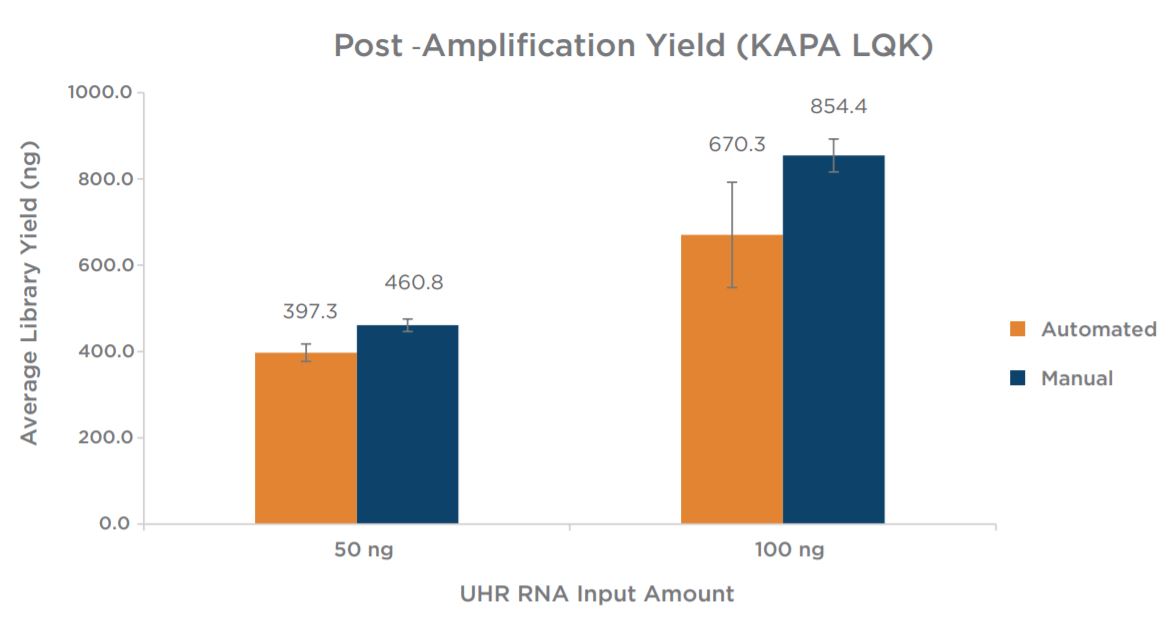
Experiment 1 results showed equivalent post-amplification yields between the automation and manually prepared libraries across the two input amounts (Figure 6). This suggests equivalency with respect to library complexity, as well as amplification efficiency.
Figure 6. Post-amplification yields indicate the automated method produces libraries with comparable yields to manually prepared samples.
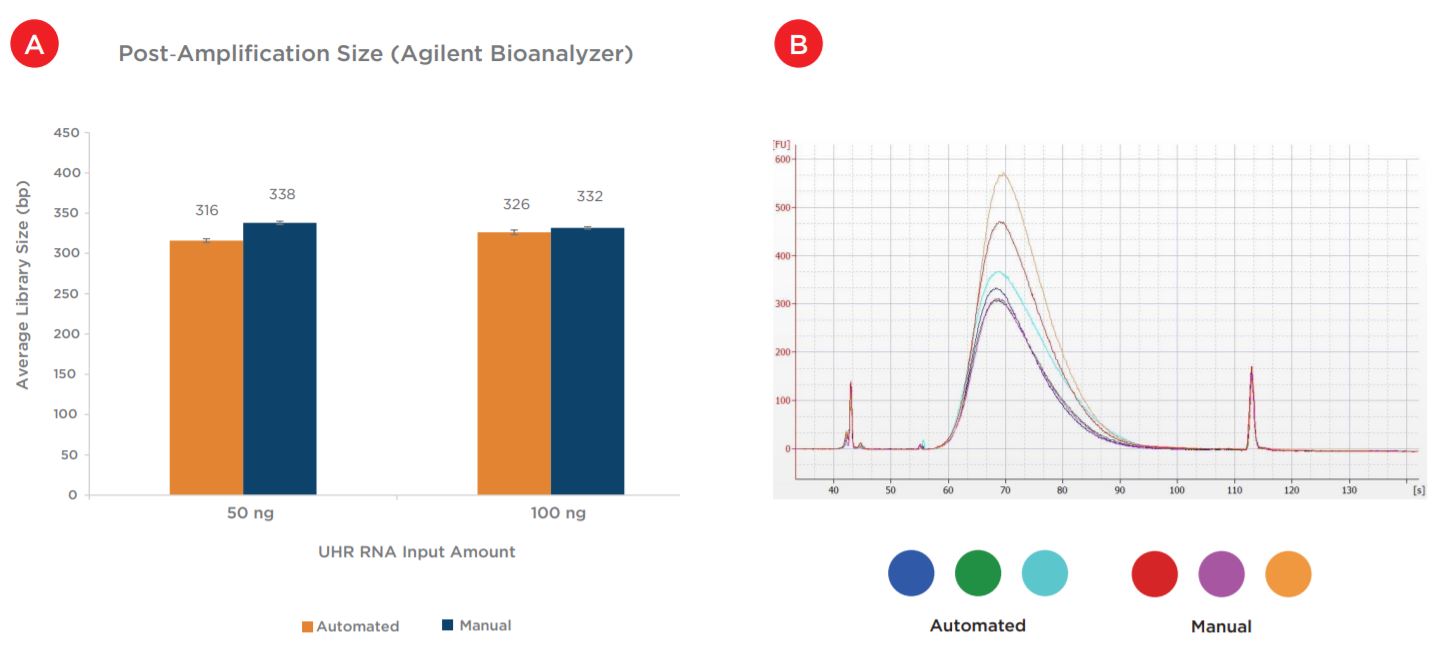
Average final library size was comparable between automated and manual preparations across the two inputs (Figure 7a). Additionally, an overlay electropherogram of the 100 ng inputs (Figure 7b) shows comparable library size distributions between both preparations.
Figures 7a and 7b. Average post-amplification sizes (a) indicate the automated method produces final libraries with comparable sizes to manually prepped samples. Representative library traces (b) of the 100 ng samples show consistent size distribution between automated and manual libraries.
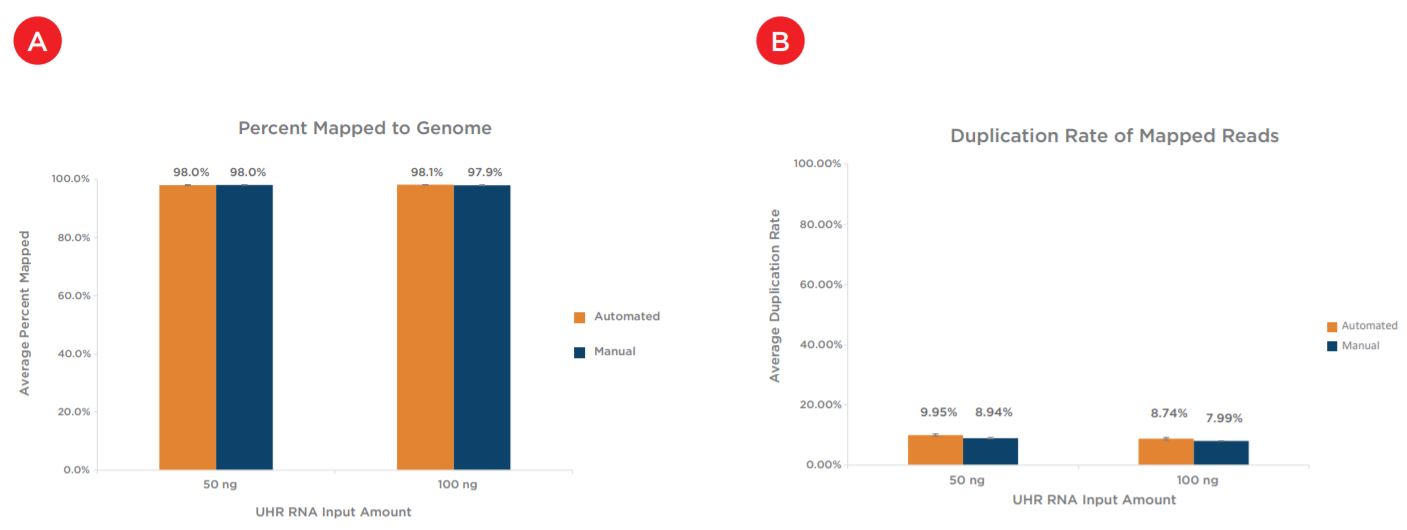
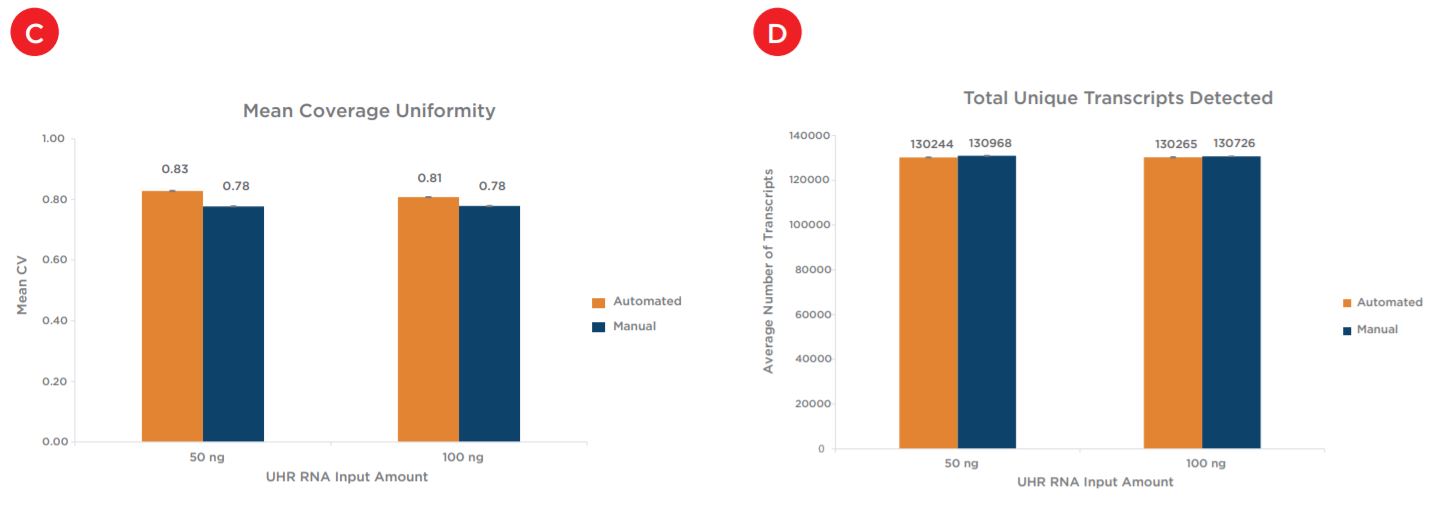
Two replicates of each condition were selected for sequencing, after subsampling the percent mapped to genome for all samples was first assessed. All samples showed mapping rates of greater than 97% (Figure 8a). The percent mapped to genome metric can be used as a global indicator of the overall sequencing accuracy and presence of contamination. Next assessed was duplication rate, for which all samples showed less than 10% duplicates and rates were comparable between both preparations and across input amounts (Figure 8b). Mean CV, or the coefficient of variation in base coverage across transcript length, was also comparable between manual and automated samples for both inputs (Figure 8c). For this metric, a smaller number is reflective of less variation in base coverage and thus, better coverage uniformity. Next shown, Figure 8d, are the total number of unique transcripts identified, which were greater than 130,000 for all samples sequenced. Sequencing reads were then binned to assess overall mapping rates between exonic, intronic and intergenic reads. mRNA enrichment intentionally biases the read distribution towards exonic (or protein-coding) reads, as shown for the 50 ng inputs in Figure 8e, and these mapping rates are comparable across both preparations. Finally, the percent of ribosomal RNA (rRNA) reads is calculated to ensure an efficient mRNA capture process with minimal rRNA carryover into library preparation. Automated samples slightly outperform manual samples for both inputs, with all samples showing less than 5% rRNA reads (Figure 8f).
Figures 8a - 8f. Comparable sequencing metrics indicate equivalent performance between automated and manual samples for both input amounts. After subsampling, data was analyzed to quantify the (a) percent mapped reads (b) percent duplicate reads (c) mean coverage uniformity (d) total unique transcripts identified (e) read distribution (exonic, intronic, v. intergenic) and (f) percent rRNA content.
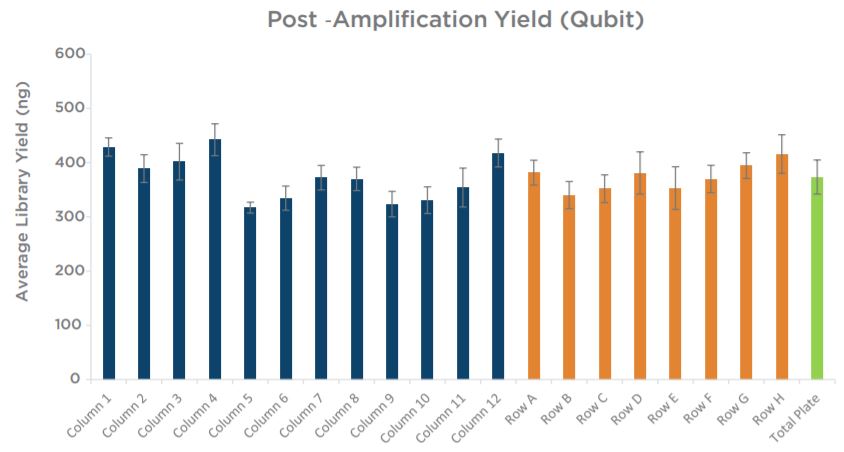
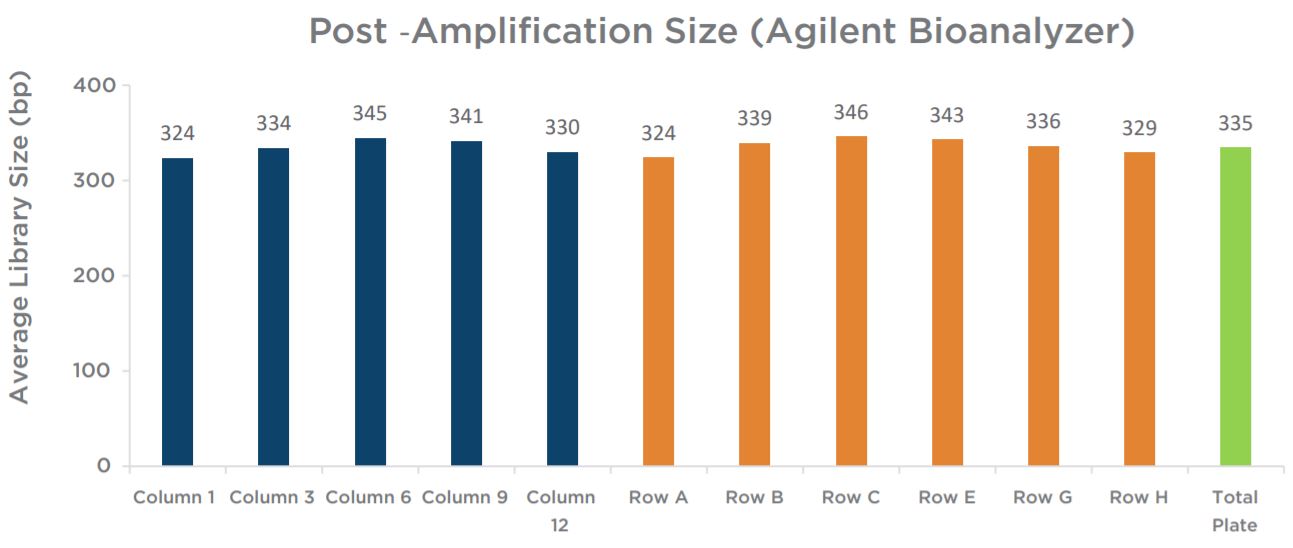
Experiment 2 final library yields showed consistent results across the plate (Figure 9). All individual columns and rows show average yields that are comparable to each other, as well as to the full plate average. Similar to the yield data, sizing results showed consistency across individual columns and rows in comparison to the full plate average size (Figure 10). Overall, results do not indicate the presence of significant plate effects.
Figure 9. Final library concentrations of all 96 KAPA mRNA HyperPrep libraries generated by the automated method are consistent across columns and rows, and comparable to the total plate average yield.
Figure 10. The average final library size of the 10 libraries assayed show consistent sizing across columns and rows, and all are comparable to the total plate average size.
Conclusion
NGS library preparation for RNA-Seq can be a time consuming and tedious process. Roche’s KAPA mRNA HyperPrep chemistry offers a streamlined single-day protocol compared to traditional approaches. Automation of Roche’s KAPA mRNA HyperPrep chemistry on the Biomek i7 provides additional savings in valuable time and money, providing researchers with more flexibility, efficiency, and reliability.
With the included dataset, performance of the KAPA mRNA HyperPrep method on the Biomek i7 Hybrid Genomics Workstation has been demonstrated. Results show that the method delivers high-quality libraries on par with those prepared manually. The automated solution offers full walk-away capability and scalability thus providing fast, efficient and reliable mRNA-Seq library construction.
Need Help?
If you are in the U.S. and have a standard Biomek i7 Genomics workstation with all of the required hardware included, please contact Roche Sequencing & Life Sciences at https://sequencing.roche. com/en-us/contact-us If you are outside of the U.S. and/or requires customization of this method, please contact Beckman Coulter Life Sciences at https://www.beckman.com/contact-us
AAG-7043FLY05.20

