Rapid Rabbit IgG Quantification using the Valita Titer Assay
Introduction
Valita Titer assays are rapid, high-throughput IgG quantification assays which use fluorescence polarization (FP) for detection. The assays rely on interactions between a fluorescently labeled IgG Fc-specific probe and the Fc of an IgG. FP effectively analyzes changes in the size of molecules, given that smaller molecules tumble more rapidly than larger ones in solution. The rotation of the molecules between absorption and emission of the photon has the effect of “twisting” the polarization of the light. When the fluorescently labeled IgG-binding peptide is unbound, it tumbles rapidly and depolarizes the light more than when it is bound to an IgG (which is ~20 times larger). Therefore, FP is measured by exciting the solution with plane polarized light and measuring the intensity of light emitted in the plane parallel to the exciting light (polarized proportion) and perpendicular to the exciting light (depolarized portion). FP is expressed as a normalized difference of these two intensities, which is typically in millipolarization units (mP).

Figure 1. Valita Titer assay principle. Small, unbound molecules rotate rapidly in solution (top), while large, bound molecules rotate slowly (bottom).
Materials and Method
Materials
- Valita Titer assay, catalogue number: VAL003, detection range: 2.5 - 100 mg/L
- CD CHO medium (GibcoTM, Catalogue No. 10743)
- BMG Labtech PHERAstar Multimode plate reader
- Monoclonal Rabbit IgG Isotype Control Antibody (LSBio, Catalogue No. LS-C742137)
- Normal Polyclonal Rabbit IgG Control (SinoBiological Catalogue No. CR1)
- ThermoFisher Finnpipette F2 Pipettes (Catalogue No. 10413865, 1187735, 11887351, 4662060)
- Starlab TipOne Tips (0.5 - 200 μL Catalogue No. S1111-1700) (1000 μL Catalogue No. S1111-6811)
Methods
BMG Labtech PHERAstar settings
| Optic Settings | Fluorescence Polarization, endpoint |
| Optic module FP 485 520 520 | |
| Focus and gain optimized from most fluorescent well (0 mg/L) | |
| 70 mP target mP for gain | |
| General settings | 200 flashes per well |
| 0.5 s settling time |
Monoclonal Rabbit IgG
Monoclonal rabbit IgG standard was reconstituted in distilled H2O to a concentration of 4 mg/mL as per the manufacturer’s instructions. Dilutions were performed in CD-CHO media to prepare an 8-point standard curve ranging from 100 mg/L to 0 mg/L. Test samples were prepared from the 4 mg/mL stock solution diluted in CD-CHO media.
Polyclonal Rabbit IgG
Polyclonal rabbit IgG was received from the manufacturers at a concentration of 1 mg/L in PBS pH 7.4. Serial dilutions were performed in CD-CHO media to prepare an 8-point standard curve ranging from 100 mg/L to 0 mg/L. Test samples were prepared from the 1 mg/mL stock solution diluted in CD-CHO media.
The assay protocol was performed using single and multichannel pipettes as follows:
Assay Procedure
- 60 μL of cell culture media was added to each well to reconstitute the
Fc-specific probe (pre-dried onto the surface of the Valita Titer plate) - 60 μL of each standard/sample was then added into appropriate wells of
the 96-well plate - A multichannel pipette was used to mix each well 3 times prior to a
5-minute incubation in the dark - Post incubation, the plate was measured using FP
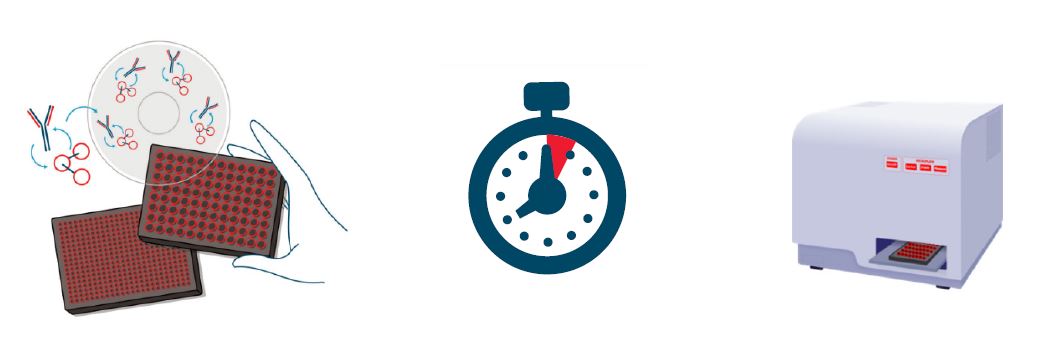
| 1. Add fresh media and IgG sample and mix. | 2. Incubate for 5 minutes at room temperature. | 3. Measure IgG using fluorescence polarization on a plate reader. |
Figure 2. Workflow schematic of Valita Titer assay.
Results
An investigation was carried out to assess the use of the Valita Titer assay to accurately detect and quantify rabbit IgG. Both monoclonal antibodies (mAb) and polyclonal antibodies (pAb) were investigated. As this is a relative quantification method, to enhance the accuracy of prediction, it is important to ensure that the molecule deployed as the standard is homogeneous to the test samples. In this example, when quantifying mAb test samples, a mAb standard curve was used for interpolation. An eight-point standard curve (0 - 100 mg/L) for each molecule was prepared in duplicate and analyzed using the Valita Titer assay. Alongside standard curve generation, samples of known concentration were interpolated against the standard curve and accuracy bias assessed.
A linear regression fit, whereby the concentration of IgG [mg/L] was plotted on the x-axis and Raw FP on the y-axis [Figure 3], was identified as the best fit for the mAb standard curve samples. The equation of the line was utilized to interpolate the concentration of mAb test samples by substituting the output Raw FP value for y and solving for x.
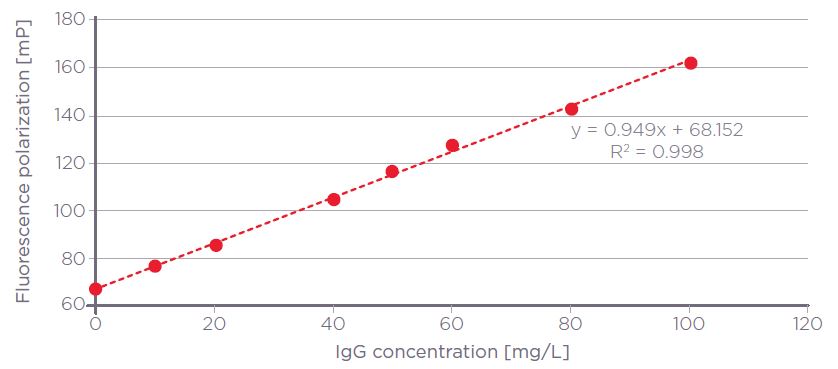
Figure 3. Rabbit monoclonal IgG Valita Titer assay standard curve plotted using a linear fit (R2 = 0.998). Error bars show standard deviation of replicates.
The Valita Titer assay accurately interpolated the known concentration of test samples with a % accuracy bias versus the known absolute concentration of ≤8%, standard deviation of ≤2 mP, and an intra-plate coefficient of variation of ≤2%, passing all typical acceptance criteria [Table 1]. Figure 4 demonstrates that output data generated using the Valita Titer assay correlates well with known absolute values, with an R2 of 0.99.
| Known IgG concentration in sample (mg/L) | Interpolated concentration rep1 (mg/L) | Interpolated concentration rep2 (mg/L) | Interpolated concentration rep3 (mg/L) | Average (mg/L) | Std. deviation [mP] | Accuracy bias (%) | Coefficient of variation (%) |
| 90 | 93.5 | 92.3 | 90.3 | 92.0 | 1.55 | -2 | 0.999 |
| 60 | 64.3 | 63.8 | 61.1 | 63.0 | 1.63 | 5 | 1.275 |
| 55 | 58.0 | 58.1 | 56.1 | 57.4 | 1.05 | -4 | 0.856 |
| 40 | 39.7 | 39.0 | 38.8 | 38.8 | 0.92 | +3 | 0.874 |
| 25 | 25.9 | 25.1 | 24.8 | 25.3 | 0.55 | -1 | 0.569 |
| 12.5 | 13.3 | 13.6 | 13.4 | 13.5 | 0.14 | -8 | 0.173 |
| 10 | 10.7 | 10.6 | 9.6 | 8.8 | 0.58 | -3 | 0.745 |
Table 1. Summary of output data from the use of Valita Titer assay for quantifying mAb test samples of known concentration.
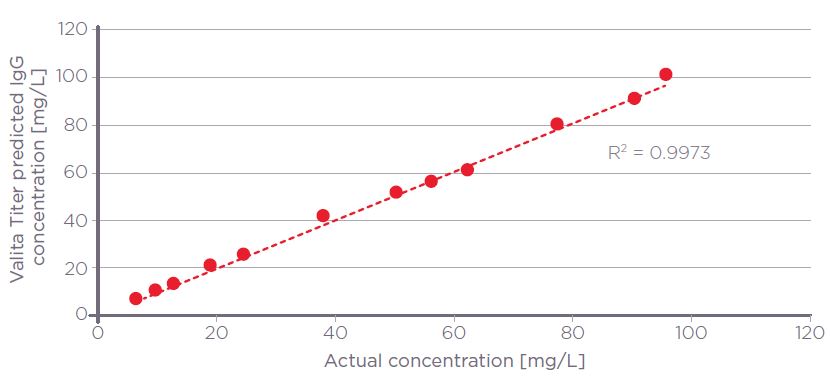
Figure 4. Valita Titer assay predicted IgG concentrations plotted against actual concentrations for rabbit monoclonal IgG (R2 = 0.9973)
A 2nd order polynomial fit was identified as the optimum fit for the pAb standard curve samples. Here, the concentration of IgG [mg/L] is plotted on the y-axis and the Raw FP on the x-axis [Figure 5]. The equation of the line was utilized to interpolate the concentration of pAb test samples by substituting the output Raw FP value for x and solving for y. The assay accurately interpolated the known concentration of test samples with a % accuracy bias versus the known absolute concentration of ≤10%, standard deviation of ≤2 mP, and an intra-plate coefficient of variation of ≤2% [Table 2]. Figure 6 demonstrates that output data generated using the Valita Titer assay correlates well with absolute values, with an R2 of 0.99.
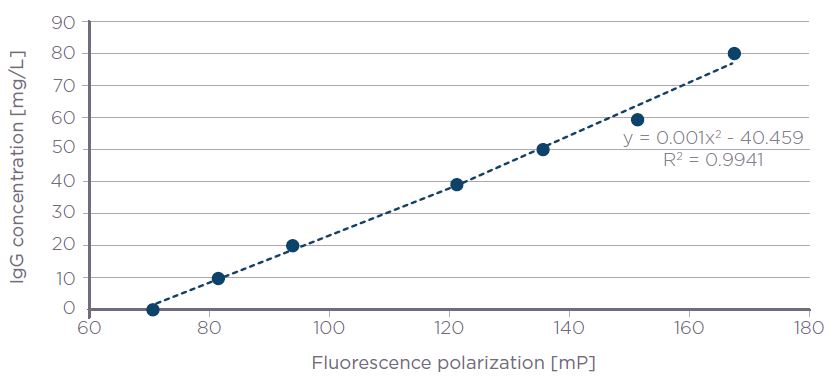
Figure 5. Rabbit polyclonal IgG Valita Titer assay standard curve plotted using a poly-2 fit (R2 = 0.9941). Error bars show standard deviation of replicates.
| Known IgG concentration in sample (mg/L) | Interpolated concentration rep1 (mg/L) | Interpolated concentration rep2 (mg/L) | Interpolated concentration rep3 (mg/L) | Average (mg/L) | Std. deviation [mP] | Accuracy bias (%) | Coefficient of variation (%) |
| 90 | 84.1 | 84.1 | 83.9 | 84.1 | 0.11 | +7 | 0.061 |
| 60 | 66.8 | 65.4 | 65.5 | 65.9 | 0.96 | -10 | 0.623 |
| 55 | 57.4 | 56.2 | 55.5 | 56.4 | 1.15 | -3 | 0.809 |
| 40 | 39.5 | 39.5 | 40.1 | 39.7 | 0.4 | +1 | 0.331 |
| 25 | 24.1 | 24.2 | 24 | 24.1 | 0.13 | +4 | 0.133 |
| 12.5 | 11.5 | 12.0 | 11.4 | 11.6 | 0.45 | +7 | 0.540 |
| 10 | 9.0 | 9.6 | 10.0 | 9.5 | 0.71 | +5 | 0.882 |
Table 2. Valita Titer is capable of accurate interpolation of polyclonal rabbit IgG samples using a standard curve.
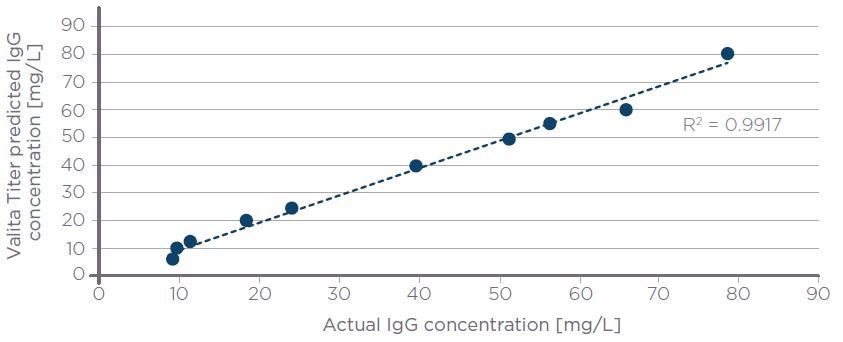
Figure 6. Valita Titer assay predicted IgG concentrations plotted against actual concentrations for rabbit polyclonal IgG (R2 = 0.9917).
Conclusions
The Valita Titer assay is capable of robust, accurate measurement of rabbit IgG standards and samples. The assay allows for high-throughput, direct, rapid and precise quantification of crude rabbit IgG samples at various stages of development.
Abbreviations
FP: Fluorescence polarization
mP: Millipolarization units
IgG: Immunoglobulin G
About the Authors
Dr. Anna Boland is a Senior Product Development Scientist at Beckman Coulter Life Sciences. She studied Molecular Medicine at Trinity College Dublin and has a PhD in Medicine from Queen’s University Belfast.
Dr. Hannah Byrne is the Global Head of Development Science at Beckman Coulter Life Sciences and leads a multidisciplinary team developing novel analytical technologies for biomanufacturing.

