Validation of On-line Total Organic Carbon Analysers for Release Testing Using ICH Q2
Introduction
As the pharmaceutical industry seeks to reduce the number and associated costs of quality control laboratory tests, reliance on results from on-line TOC analysers for product release is becoming more attractive. The International Conference on Harmonisation (ICH) is an expert working group with representation from the United States2, European3, and Japanese4 Pharmacopoeias. In their harmonised tripartite guideline ICH Q21, Validation Of Analytical Procedures, they outline characteristics for consideration during the validation of analytical procedures included as part of registration applications submitted within the EC, Japan and USA. This paper discusses how these characteristics may be applied to on-line Total Organic Carbon (TOC) analysers to enable them to be used to provide release test data for Water for Injection (WFI) and Purified Water (PW).
To watch the webinar on this topic, scroll to the bottom of this page.
TOC analysers overview
TOC analysers measure one of the four key critical quality attributes mandated by the pharmacopoeias. TOC analysis is a non-specific test, i.e. it is simply a measure of the carbon found in any organic compound in the water, it cannot tell you what type of organic molecule is present. A pharmaceutical-grade TOC analyser uses ultra-violet light (UV) to oxidise the organic molecules to release the carbon atoms present and then measures the difference in water conductivity caused by the resultant carbon dioxide.
TOC is to be calculated by measuring Total Inorganic Carbon (TIC) and Total Carbon (TC) and subtracting one from the other.
TC - TIC = TOC
Figure 1. TIC and TC are measured and TOC is calculated
The European Pharmacopoeia chapter on TOC for PW and WFI, EP 2.2.44, calls for complete oxidation of the organic molecule for accurate TOC analysis, i.e. if some of the carbon atoms are not oxidised and remain bound into the organic molecule, then they would not be measured and the TOC analyser would under-report TOC. For this reason it is important that the TOC analyser is capable of detecting when oxidation is complete before reporting TOC levels.
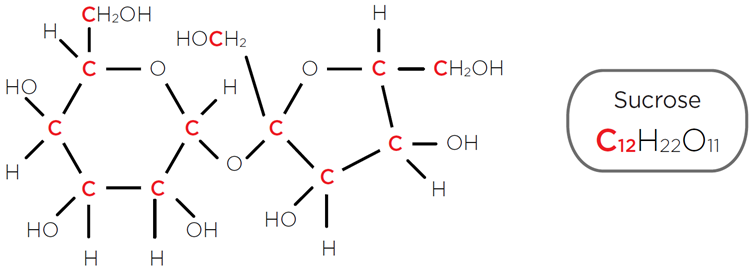
TOC results are reported in Parts Per Billion (ppb) which in this case is the mass (weight) of organic carbon per litre of water. Longer-chain complex organic molecules will contain more carbon atoms than short-chain organic molecules, so equivalent numbers of the long- and short-chain molecules will be reported differently by the TOC analyser, with reported TOC from the long-chain organics delivering higher TOC results.

Figure 2. Organic molecule sucrose contains 12 carbon atoms
Overview of ICH Q2
The ICH Q2 guideline covers three different applications for analysers: Identification, Testing for Impurities and Assay tests. TOC analysers used to test PW and WFI for contamination naturally falls under the Testing for Impurities application. ICH Q2 goes on to differentiate between the validation characteristics required for those analysers used for limit testing of impurities and those used for quantitative analysis of impurities. ICH Q2 validation characteristics to be considered:
- Accuracy
- Precision
- Repeatability
- Intermediate precision
- Specificity
- Detection Limit
- Quantitation Limit
- Linearity
- Range
On-line TOC analysers have the purpose of determining that the compendial limit of 500 ppb is not breached, but they are also used for trending TOC levels and as such they fall under the scope of the validation characteristics applied to both quantitative testing and limit testing analysers.
The bulleted list above lists the validation characteristics used to determine the suitability of a TOC analyser. Whilst robustness is not listed, ICH Q2 recommends this aspect of validation during initial qualification of the analyser and at suitable periods thereafter.
Demonstrating Compliance to ICH Q2
Accuracy
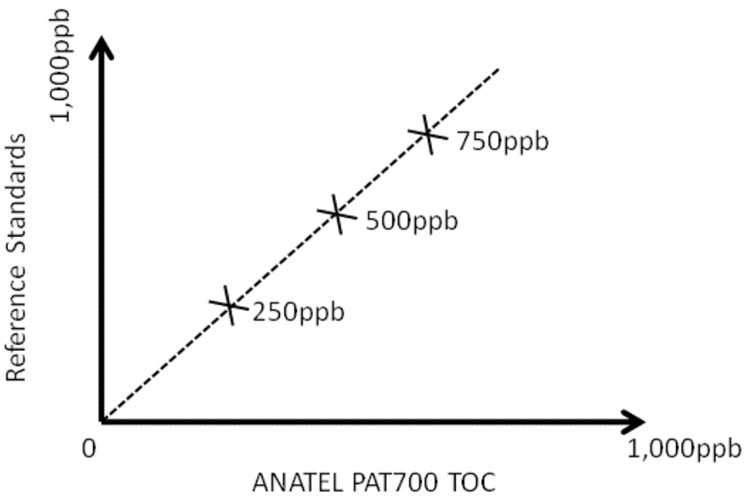
ICH Q2 suggests that accuracy may be established by determining the closeness of agreement between the analyser and an accepted reference value. For TOC analysers, this can be achieved by carrying out a calibration validation, e.g. by running certified TOC standards as grab samples and determining if the results provided by the analyser are within accepted/specified performance limits. Naturally the analyser should have had a calibration adjustment before carrying out this test, i.e. the normal calibration adjustment procedure recommended by the manufacturer should have been carried out.

Figure 3. Determining accuracy of the TOC analyser using certified TOC standards
ICH Q2 suggests that accuracy should be demonstrated using 3 replicates of 3 concentrations, as shown in Figure 3.
Precision
The validation of analysers for quantitation of impurities includes an investigation of precision. ICH Q2 recommends the determination of precision of repeatability be validated using 3 replicates each of 3 certified standards at different concentrations. It also recommends that the effect of environmental changes and human error on the intermediate precision of the analyser be validated.
Specificity
This establishes the analyser’s ability to measure the analyte of interest in the presence of potentially interfering substances. In the case of a modern PW or WFI system, the challenge TOC analysers face is that the TOC levels are relatively small, often less than 30ppb, whereas the levels of TIC and TC are comparatively high, sometimes between 1,000ppb and 2,000ppb. As stated in Figure 1, TOC analysers measure TIC and TC and then calculate TOC. Small errors in measuring TC and TIC can lead to big errors in calculated TOC. This problem is most noticeable in TOC analysers that have separate sensors to measure TC and TIC, see example in Figure 3.
| Example: | Results: | ||
| Actual TC | 1000 ppb | Measured TC | 980 to 1020 ppb |
| Actual TIC | 990 ppb | Measured TIC | 970 to 1010 ppb |
| Actual TOC | 10 ppb | Calculated TOC | -30 to 50 ppb |
| Sensor measurement error +/- 2% | |||
Figure 4. Error in reported TOC due to interference from TIC
Detection Limit
The pharmacopoeias state that suitable TOC analysers must have a detection limit (LOD) of ≤50ppb. Validating such a low level of TOC is difficult using traceable TOC standards as these are generally not available. Equally, attempting to make your own TOC solution at 50ppb is not practical. ICH Q2 suggests an alternative is to calculate the LOD by running multiple samples from a blank TOC solution (<100ppb TOC according to the pharmacopoeias) and using the standard deviation between the measurements to calculate the LOD, see Figure 5.
LOD = 3.3 σ / S
where LOD = Limit of detection
σ = The standard deviation of the blank sample results
S = The slope of the calibration curve
Figure 5. Calculating the limit of detection
Quantitation Limit
This is the lowest level of TOC that the analyser can accurately measure and report TOC values. Like the LOD, this can be difficult to establish using traceable TOC standards as these are generally not available. ICH Q2 again suggests an acceptable method to validate this is characteristic is by running multiple analyses of blank samples and using the standard deviation to calculate the quantitation limit, see Figure 6.
QL = 10 σ / S
where QL = Quantitation limit
σ = The standard deviation of the blank sample results
S = The slope of the calibration curve
Figure 6. Calculating the limit of quantitation
As can be seen from the formulas in Figure 5 and Figure 6, the limit of quantitation is approximately three times the detection limit.
Linearity
Linearity, when applied to TOC analysers, is the ability to draw a straight line through three or more points on the TOC analyser calibration curve. This may be ascertained by running three or more certified TOC standards on the analyser. As long as the linearity correlation coefficient is >0.99, then the analyser can be said to have a linear response. The correlation coefficient can be calculated during calibration if three or more calibration standards are used.
Range
Pharmaceutical-grade TOC analysers are designed to demonstrate that the 500ppb limit defined in the pharmacopoeia has not been exceeded. The acceptable range of a pharmaceutical TOC analyser is established by confirming that the analytical procedure provides an acceptable degree of linearity, accuracy and precision when applied to samples containing amounts of TOC within or at the extremes of the specified range of the analytical procedure. As the specified maximum is 500ppb, then the linearity, accuracy and precision must be demonstrated around this maximum. ICH Q2 recommends testing with certified TOC standards of at least +/-20% of the maximum. It is common practice to use 250, 500 and 750ppb calibration standards to determine the linearity and accuracy of the TOC analyser around the 500ppb maximum range as this exceeds the +/-20% required, giving +/-50% of the maximum.
Robustness
The robustness characteristic is used to demonstrate the reliability of an analyser with respect to deliberate variations in method parameters. For TOC analysers, the United States and European pharmacopoeias suggest that this is established using the System Suitability Test (SST), where the analyser response to TOC standards in deliberately varied organic materials is tested to ensure there is no large variation in results. Solutions of easily oxidised sucrose and difficult to oxidise benzoquinone, both containing 500ppb of carbon, are analysed on the TOC analyser. To demonstrate that the analyser is robust the reported results from both SST solutions must be within +/-15% of each other.
How the PAT700 on-line TOC analyser from Beckman Coulter demonstrates compliance to ICH Q2
The PAT700 from Beckman Coulter is designed to support compliance to ICH Q2 using the following:
| ICH Q2 Characteristic | How the PAT700 Demonstrates Compliance to ICH Q2 |
| Accuracy | Calibration validation using triple replicates of three certified TOC standards |
| Precision | |
| Repeatability | Calibration validation using triple replicates of three certified TOC standards |
| Intermediate precision | Automated, pre-programmed SOPs combined with no manual data entry and automatic pass/fail calculations removes opportunities for human error |
| Specificity | Single measurement sensor for TIC and TC means PAT700 is not affected by the presence of large amounts of TIC, unlike TOC analysers that use separate sensors to measure TIC and TC and calculate TOC |
| Detection limit | Run multiple samples of a blank and calculate using ICH Q2 formula |
| Quantitation limit | Run multiple samples of a blank and calculate using ICH Q2 formula |
| Linearity | Use built-in calibration SOP, which automatically calculates and reports the linearity correlation coefficient and only allow a 'pass' if this is >0.990 |
| Range | 250, 500 and 750 ppb calibration standards to determine the linearity and accuracy of the TOC analyser around the 500 ppb test limit |
| Robustness | Use System Suitability test to demonstrate that analyser is reliable and not susceptible to errors when deliberate variations in method parameters are made |
References
- International Conference on Harmonisation of Technical Requirements for Registration of Pharmaceuticals for Human Use VALIDATION OF ANALYTICAL PROCEDURES: TEXT AND METHODOLOGY ICH Q2 9, ICH Secretariat, Chemin des Mines, 1202 Geneva, Switzerland http://www.ich.org/products/guidelines/quality/article/quality-guidelines.html
- U.S. Department of Health and Human Services Food and Drug Administration United States Pharmacopoeia U.S. Department of Health and Human Services Food and Drug Administration Center for Drug Evaluation and Research (CDER) Center for Biologics Evaluation and Research (CBER) Office of Regulatory affairs (ORA) Division of Drug Information, HFD-240 Center for Drug Evaluation and Research Food and Drug Administration 5600 Fishers Lane, Rockville, MD 20857 USA
- Council of Europe European Directorate for the Quality of Medicines & Healthcare European Pharmacopoeia (Ph. Eur) 9th Edition. EDQM Council of Europe, 7 allée Kastner, CS 30026, F-67081 Strasbourg, France https://www.edqm.eu/en/european-pharmacopoeia-9th-edition
- The Japanese Ministry of Health Labour and Welfare, The Japanese Pharmacopoeia, Seventeenth Edition, Pharmaceuticals and Medical Devices Agency, Shin-Kasumigaseki Building, 3-3-2 Kasumigaseki, Chiyoda-ku, Tokyo 100-0013 Japan https://www.pmda.go.jp/english/rs-sb-std/standards-development/jp/0019.html

