Whole Genome Sequencing of Microbial Communities for Scaling Microbiome and Metagenomic Studies Using the Echo 525 Liquid Handler and CosmosID
Jefferson Lai, Jared Bailey, Rabia Khan, and John LesnickIntroduction
Our understanding of the role of the human microbiome in health and disease has been growing rapidly in recent years. Amplicon sequencing of highly conserved 16S ribosomal RNA (rRNA) regions has long been the standard technique used to assess patient microbial diversity, however there are limitations to this method. 16S rRNA amplicon sequencing only captures prokaryotic diversity and misses eukaryotic and viral components of the microbiome. While an additional amplicon sequencing of the internal transcribed spacer 1 (ITS1) region can capture fungal diversity, there is no known parallel technique for viral detection. Furthermore, these rRNA amplicon methods are generally only specific to the genus. To obtain specieslevel differentiation, multiple variable regions of the rRNA need to be assessed in repeated experiments. Even if the prokaryotic species has been correctly identified, important strain information is not detected. Strain-to-strain variation is responsible for pathogenicity, toxins, virulence factors, epitopes, and antibiotic resistance characteristics.
Whole genome sequencing (WGS) can determine strain-to-strain variation and has more applications beyond microbial community identification. Metagenomic homolog discovery from uncharacterized organisms is enabling and accelerating pathway design for production of molecules of interest. Using WGS, biologists are prospecting for natural enzymatic solutions to their challenges. Miniaturizing WGS significantly lowers the cost to sequence and discover, as well as reducing process cycle time. As researchers continue to deepen our understanding of human microbiome implications on health and disease, and as biologists explore the metagenomic space, our tools and analyses need to scale accordingly.
A workflow utilizing the Echo 525 Liquid Handler can provide the solution to cost-effectively scale WGS of microbiomes to meet the demands of this new era of microbiome research. In this study, we demonstrate that the Echo 525 Liquid Handler can be used to miniaturize WGS of microbial communities. Raw data can be processed, analyzed, and ready for interpretation within the hour, by utilizing CosmosID’s best-in-class microbiome bioinformatics platform.
Materials
Illumina Nextera XT Library Preparation Workflow to Generate Libraries for Sequencing
Microbial standards and mock communities were obtained from Zymo Research, ATCC, and NIST for this study. Both the Zymo Research sample (D6305) and ATCC sample (MSA-1002) are microbial standards with even genomic weight distribution per organism, meant to benchmark accuracy and bias introduced by library preparation or sequencing. The NIST sample is a mock community developed for the NIST-CosmosID MVP challenge to identify and understand measurement bias associated with library preparation techniques and NGS platforms. By utilizing the Echo 525 Liquid Handler, we reduced the tagmentation reaction ten-fold to 2 µL and sample gDNA input to 500 pg total DNA for each community standard and mock community. Indexing primers were sourced from Integrated DNA Technologies (IDT) and delivered directly in Echo-qualified 384-well source plates. The indexing amplification reaction was reduced ten-fold to 5 µL, which enabled a reduced volume SPRI bead cleanup. We ran a 100-fold reduced-volume Quant-iT Picogreen assay for quantitation of the purified indexed library, and fragment size analysis via Agilent TapeStation, both enabled with the Echo 525 Liquid Handler. Libraries were rapidly pooled and normalized in one step using the Echo 525 Liquid Handler, then denatured and diluted down to a 20 pM final concentration. Libraries were then loaded on an Illumina MiSeq v3 150-cycle kit, with 1% PhiX control, to generate high quality data. This process was carried out in 384-well formats, showing scalability for high-throughput multiplexed sequencing and metagenomics. Details of this method are described in the methods section.
Data Analysis and Bioinformatics
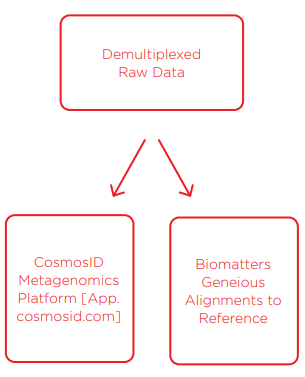
Upon completion of sequencing, data was uploaded to Illumina BaseSpace and demultiplexed there and on the MiSeq instrument. Then, we used two forms of analysis; 1) traditional alignments of raw data to each given reference genome using Biomatters Geneious software, and 2) uploading raw data to CosmosID’s cloud metagenomics platform. Traditional alignments were resource-intensive and not high-throughput. We performed alignments on the ATCC and Zymo samples but were unable to on the NIST samples as the reference organisms were unknown. The CosmosID cloud-based bioinformatics platform for microbiome analysis was used to evaluate our data down to strain resolution. CosmosID’s platform is extremely fast, analyzing all 12 of our samples in 30 minutes compared to the multiple days needed for traditional alignments. This platform recently received highest marks in both the Mosaic Community Challenge, presented by DNAnexus and the Janssen Human Microbiome Institute, and the FDA CFSAN Pathogen Detection Challenge.
Method
Samples tested: ATCC, NIST, Zymo
Sample gDNA concentration: 1 ng/µL
Biological replicates: Quadruplicate
| Tagmentation | Protocol (µL/rxn) | 1/10 | Echo Calibration |
| gDNA Sample | 5 | 0.5 | 384PP_AQ_BP |
| ATM+TD Buffer | 15 | 1.5 | 384PP_AQ_GPSB |
| Total volume | 20 | 2 |
Spin @ 1500g, 30 seconds ➜ Tagmentation reaction ➜ 55°C (5 min) ➜ 10°C (forever)
| Add NT | Protocol (µL/rxn) | 1/10 | Echo Calibration |
| Tagmentation reaction | 20 | 2 | From previous |
| NT Buffer | 5 | 0.5 | 384PP_AQ_SPHigh |
| Total volume | 25 | 2.5 |
Spin @ 1500g, 30 seconds ➜ Incubate 5 min RT
| Indexing Amplification | Protocol (µL/rxn) | 1/10 | Echo Calibration |
| Tagmentation reaction | 25 | 2.5 | From Previous |
| Indexing Primer 1 (100 µM) (N7XX) | 5 | 0.05 | 383PP_AQ_BP |
| Indexing Primer 2 (100 µM) (S5XX) | 5 | 0.05 | 384PP_AQ_BP |
| dH2O | 0 | 0.9 | 384PP_AQ_BP |
| NPM | 15 | 1.5 | 384PP_AQ_GPSB |
| Total volume | 50 | 5 |
Spin @ 1500g, 30 seconds
| PCR Reaction | |
| 72°C | 3 min |
| 95°C | 30 sec |
| 95°C | 10 sec |
| 55°C | 30 sec |
| 72°C | 30 sec |
| 72°C | 5 min |
| 4°C | forever |
| SPRI Bead Cleanup | Protocol (µL/rxn) | 5-Jan |
| PCR Reaction | 25 | 5 |
| AmpureXP Magnetic Beads | 45 | 9 |
| Total volume | 70 | 14 |
SPRI Bead Cleanup
- Gently pipette entire volume up and down 10 times. Incubate at room temperature without shaking for 5 minutes.
- Place on magnet plate for 2 minutes or until solution clarifies.
- While still on magnet plate, use a multichannel pipette to remove and discard 11 µL supernant.
- Using a multichannel pipette, add 30 µL of 80% ethanol to each well. Incubate 30 seconds.
- Using a multichannel pipette, remove all ethanol. Repeat the ethanol wash a second time.
- While still on magnet plate, allow drying for 5 minutes.
- Remove sample plate from magnet plate. Add 20 µL ddH2O, carefully mixing beads into solution. Incubate at room temperature for 2 minutes, no shaking.
- Place sample plate on magnet plate, allowing solution to clarify
- Using a multichannel pipette, remove 15 µL of solution to a fresh sample collection plate (Echo Qualified 384LDV PLUS Microplate).
For our miniaturized 2 µL tagmentation reaction, we sought to include 500 pg of total DNA in 500 nL total volume. For samples with concentrations over 1 ng/µL, less sample volume was used and diluted with molecular biology grade water to achieve 500 pg total DNA in 500 nL total volume. EDTA should not be used as a diluent because it can inhibit the enzymatic activity of the tagmentase.
For our miniaturized 5 μL amplification reaction, our indexing primers were sourced from IDT. IDT supplied us with 100 μM indexing primers, volume normalized to 60 μL per index, in an Echo-Qualified 384-well source plate. Using the Echo 525 Liquid Handler, we transferred primers directly from the source plate, and since the concentration is higher than that provided by the protocol, we transferred 100-fold miniaturized primers and added water to maintain proper reaction volume.
SPRI bead cleanup followed the Agencourt AmpureXP PCR purification protocol for 384-well format. We utilized 9 µL of beads for our 5 µL amplification reaction and eluted in 20 µL.
The Quant-iT Picogreen protocol was performed according to the ThermoFisher standard protocol, but volumes were miniaturized 100-fold from 2 mL to 20 µL in a Greiner 384-well clear-bottom plate. Results were read on a BMG Pherastar multimode reader. Fragment size analysis was performed on the Agilent TapeStation 2200. The Echo 525 Liquid Handler was used to accurately dispense library DNA for both QC measures.
Combining concentration data from the Picogreen assay and fragment size analysis, we built a normalization worklist in Excel to obtain equimolar pooling of samples. Normalization can be accomplished simultaneously during pooling using the direct dilution capability of the Echo 525 Liquid Handler. Once the pool has been created, we used the QuBit dsDNA High Sensitivity kit to determine the concentration. Using fragment size as a relational guide between concentration and molarity, we diluted our library to 4 nM. Finally, we denatured with 0.2N sodium hydroxide, added 1% PhiX control, and loaded a MiSeq v3 150-cycle kit to 20 pM.
Results and Discussion
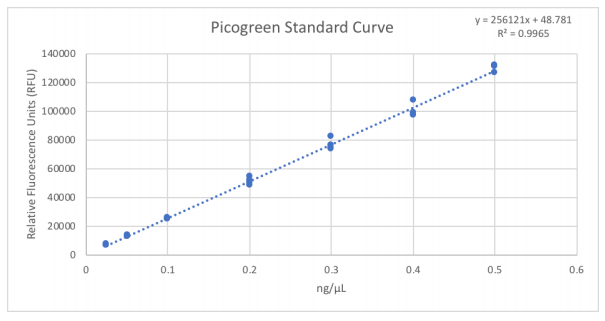
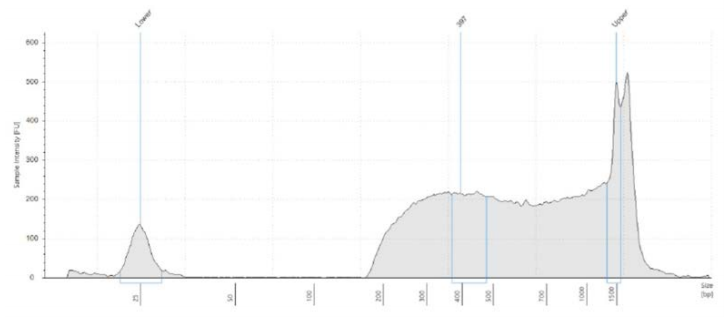
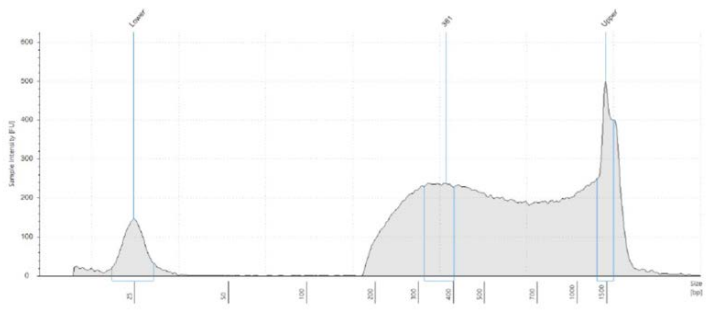
Library QC measures are necessary considerations for downstream normalization, pooling, and dilution for MiSeq loading. In Figure 1, we utilized the Echo 525 Liquid Handler to dispense accurate and precise amounts of the standard lambda DNA to generate the Picogreen standard curve. Because the instrument transfers in 25 nL increments, we generated these points by direct dilution, thus avoiding propagation errors in serial dilution. We then transferred 1 µL of our library samples via the Echo 525 Liquid Handler into 19 µL of Picogreen dye and TE solution, resulting in a dilution factor of 20. This assay volume ensures that the wells of the Greiner 384-well clear-bottom plate are covered in solution. Further reduction of this assay is possible if using a low-volume plate. Results shown in Table 1 indicate that our average total yield is 8.19 ng/µL with 8.5% CV. We also used the Echo 525 Liquid Handler to dispense 2 µL of sample into a 96-well plate for Agilent TapeStation 2200 fragment size analysis. We dispensed the buffer-dye manually for this throughput, though it can be dispensed via the Echo system as well. As shown in Figure 2, fragment sizes were consistent, meaning our DNA to tagmentase ratio was consistent, yielding an average fragment size of 379 bp. We used the D1000 High-Sensitivity tape, however a D5000 tape can also be used to visualize fragment size, especially larger fragments.
SPRI bead cleanup after PCR is essential to minimize any interference and unwanted products for subsequent sequencing steps. Depending on the efficiency of the SPRI bead cleanup, the number of PCR cycles can be increased to reach target yield. As the user implements the process, increasing cycles to generate more product must be balanced with potential amplification biases, and this point varies amongst sample and GC composition. These results show that we produced sufficient quantity of library using a ten-fold miniaturized 5 µL amplification reaction with 14 cycles and five-fold miniaturized SPRI bead cleanup. SPRI beads are an expensive component of the process, and we dramatically reduce the usage of beads per reaction due to our miniaturized reaction size.
We used the quantitation and sizing information to generate a normalization pooling w.orklist, which transfers various volumes to a single well to reach equimolar distribution of each sample.
Figure 1: Picogreen standard curve generated by using the Echo 525 Liquid Handler. The instrument is able to perform accurate and precise transfers of the lambda DNA used in this standard curve by direct dilution, avoiding propagation of errors in serial dilution.
Picogreen Quantitation Data - RFUs converted to [DNA]
| Sample | ng/µL | Sample | ng/µL | Sample | ng/µL |
| ATCC_1 | 9.2 | NIST_1 | 8.18 | Zymo_1 | 7.51 |
| ATCC_2 | 7.62 | NIST_2 | 7.61 | Zymo_2 | 8.23 |
| ATCC_3 | 9.2 | NIST_3 | 8.63 | Zymo_3 | 8.84 |
| ATCC_4 | 8.51 | NIST_4 | 7.06 | Zymo_4 | 7.73 |
Table 1: An overview of the sample quantities, after SPRI bead cleanup, converted from relative fluorescence units (RFUs) to concentration (ng/µL) based on the standard curve. Using the standard curve equation, we solved for concentration: [DNA] = (Dilution Factor)*(RFU-48.781)/256121. Our average total yield is 8.19 ng/µL with 8.5% CV, demonstrating a 10-fold miniaturized 5 µL amplification reaction generated sufficient amount of library to sequence.
A. ATCC
B. NIST
C. Zymo
Figure 2A-C: Fragment size electropherograms of a) ATCC sample, b) NIST sample and c) Zymo sample, post-Nextera XT and bead cleanup. Average fragment size was 379 bp, so to make a 4 nM library we pooled and diluted our samples to 1 ng/µL.
MiSeq Run Metrics
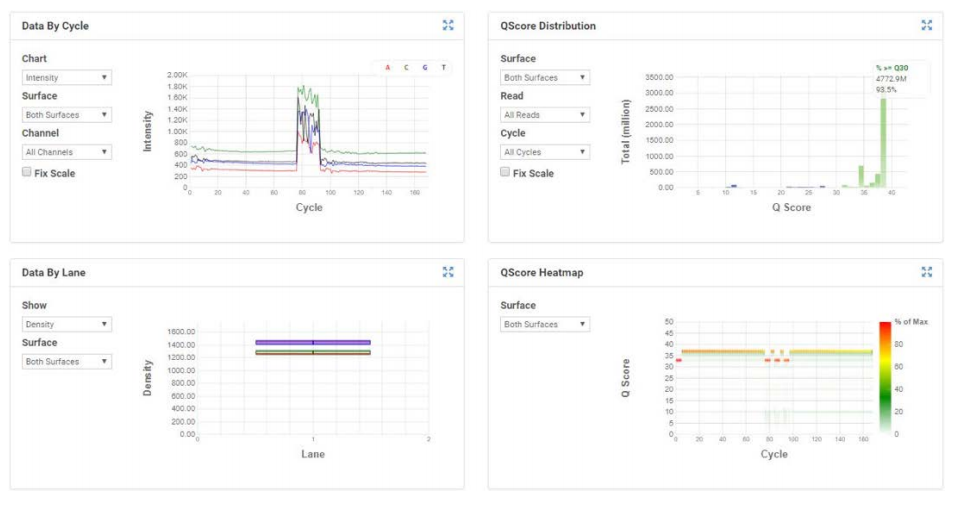
Figure 3 shows the MiSeq run metrics when loaded using the process described above. We achieved a cluster density of 1400K/mm2, which produced 93.5% reads >Q30 and 89% clusters passing filter. The CV of reads distributed per sample is 17.9%. The middle indices, representing the NIST replicates, all came in low compared to the rest. Raw data generated from the MiSeq was then demultiplexed on the instrument as well as uploaded and demultiplexed in the BaseSpace cloud. FASTQ data was then analyzed in two ways; 1) traditional alignments of FASTQ data to the given reference genomes using the Biomatters Geneious software and mapping algorithm, and 2) CosmosID’s rapid microbiome strainlevel identification platform. For traditional alignments, we were only able to align one replicate due to computing resource limitations. However, CosmosID’s cloud platform was able to analyze all replicates and samples in a mere 30 minutes.
Figure 3: MiSeq run metrics and index distribution of samples. The v3 150-cycle kit was loaded to a cluster density of 1400K/mm2, produced 93.5% reads >Q30 and clusters passing filter of 89%. The CV of reads per sample is 17.9%.
| CosmosID | Geneious | |||||||
| Sample | Organism | Reference | Average Abundance | Abundance CV | Total Matches | Total Matches CV | Abundance | Total Matches |
| Zymo D6305 | Pseudomonas aeruginosa | 12 | 11.13% | 4.53% | 98.09% | 0.22% | 19.99% | 96.10% |
| Escherichia coli | 12 | 9.45% | 0.96% | 97.09% | 0.46% | 14.81% | 90.80% | |
| Salmonella enterica | 12 | 10.68% | 1.05% | 95.22% | 0.33% | 19.55% | 93.10% | |
| Lactobacillus fermentum | 12 | 25.18% | 1.69% | 99.63% | 0.08% | 10.97% | 86.30% | |
| Enterococcus faecalis | 12 | 11.13% | 2.44% | 92.23% | 1.22% | 6.60% | 78.02% | |
| Staphylococcus aureus | 12 | 6.56% | 3.40% | 79.30% | 2.21% | 5.91% | 86.69% | |
| Listeria monocytogenes | 12 | 11.01% | 2.69% | 91.92% | 1.12% | 7.19% | 91.10% | |
| Bacillus subtilis | 12 | 14.46% | 1.18% | 96.59% | 0.61% | 11.22% | 85.80% | |
| Saccharomyces cerevisiae | 2 | 29.89%* | 63.03% | 15.57% | 9.31% | 1.50% | 28.41% | |
| Cryptococcus neoformans | 2 | 68.93%* | 28.23% | 18.57% | 8.85% | 2.89% | 36.96% | |
| Average Total Reads/CV | 5,519,000.50 | 6.50% | * = calculated separately from bacteria | |||||
| CosmosID | Geneious | |||||||
| Sample | Organism | Reference | Average Abundance | Abundance CV | Total Matches | Total Matches CV | Abundance | Total Matches |
| ATCC MSA1002 | Acinetobacter baumannii | 5 | 3.48% | 3.88% | 60.56% | 3.85% | 3.83% | 82.60% |
| Actinomyces odontolyticus | 5 | 12.50% | 4.23% | 98.58% | 0.31% | 8.60% | 99.90% | |
| Bacillus cereus | 5 | 8.35% | 5.12% | 83.88% | 0.86% | 13.66% | 94.10% | |
| Bacteroides vulgatus | 5 | 5.93% | 3.30% | 75.18% | 3.00% | 5.26% | 86.10% | |
| Bifidobacterium adolescentis | 5 | 11.66% | 5.52% | 98.28% | 0.39% | 7.45% | 99.90% | |
| Clostridium beijerinckii | 5 | 3.61% | 16.31% | 54.48% | 4.81% | 4.83% | 65.40% | |
| Deinococcus radiodurans | 5 | 2.12% | 3.94% | 91.96% | 0.83% | 5.68% | 98.80% | |
| Enterococcus faecalis | 5 | 4.67% | 3.27% | 74.43% | 2.33% | 3.94% | 87.90% | |
| Escherichia coli | 5 | 2.82% | 12.64% | 86.57% | 5.63% | 10.35% | 98.60% | |
| Helicobacter pylori | 5 | 3.93% | 3.93% | 69.68% | 3.39% | 2.12% | 84.40% | |
| Lactobacillus gasseri | 5 | 5.19% | 3.29% | 69.72% | 3.30% | 2.55% | 80.50% | |
| Neisseria meningitidis | 5 | 3.34% | 3.89% | 74.62% | 1.69% | 3.24% | 93.40% | |
| Porphyromonas gingivalis | 5 | 7.16% | 1.64% | 87.84% | 1.28% | 3.87% | 96.20% | |
| Propionibacterium acnes | 5 | 0.71% | 1.30% | 91.73% | 0.46% | 4.83% | 98.90% | |
| Pseudomonas aeruginosa | 5 | 2.24% | 2.85% | 75.94% | 0.82% | 9.85% | 86.40% | |
| Rhodobacter sphaeroides | 5 | 7.43% | 3.61% | 86.01% | 1.33% | 6.94% | 97.50% | |
| Staphylococcus aureus | 5 | 2.34% | 5.32% | 52.32% | 6.15% | 3.05% | 71.30% | |
| Staphylococcus epidermidis | 5 | 3.90% | 3.94% | 58.84% | 4.15% | 2.71% | 69.10% | |
| Streptococcus agalactiae | 5 | 4.10% | 4.62% | 69.28% | 3.73% | 2.71% | 80.20% | |
| Streptococcus mutans | 5 | 4.29% | 3.56% | 71.36% | 2.71% | 2.48% | 80.20% | |
|
|
Average Total Reads/CV | 5,058,782 | 3.03% | |||||
| CosmosID | ||||||
| Sample | Organism | Reference | Average Abundance | Abundance CV | Total Matches | Total Matches CV |
| NIST | Halobacillus halophilus | 10 | 12.97% | 0.68% | 9.82% | 2.44% |
| Bacillus subtilis | 10 | 9.02% | 1.94% | 89.81% | 2.76% | |
| Staphylococcus epidermidis | 10 | 8.87% | 1.40% | 89.81% | 4.63% | |
| Enterococcus faecalis | 10 | 10.09% | 1.13% | 90.88% | 2.56% | |
| Chromobacterium violaceum | 10 | 10.35% | 1.29% | 86.56% | 4.64% | |
| Pseudomonas fluorescens CID | 10 | 13.56% | 0.49% | 95.39% | 2.00% | |
| Haloferax volcanii | 10 | 9.38% | 1.24% | 81.11% | 5.46% | |
| Pseudoalteromonas CID | 10 | 12.34% | 1.34% | 92.01% | 2.41% | |
| Pseudoalteromonas sp ND6B | 10 | 0.13% | 0.00% | 1.44% | 3.22% | |
| Micrococcus luteus | 10 | 8.59% | 1.13% | 78.29% | 5.64% | |
| Escherichia coli | 10 | 4.67% | 9.82% | 91.79% | 8.55% | |
| Average Total Reads/CV | 3,791,315 | 16.96% | ||||
Table 2: An overview of results. Abundance refers to the percentage of reads identified to an organism out of the total reads and should be compared to reference. Total Match is a measure of how much of the reference genome was covered. For CosmosID, all four replicates were averaged, and CV calculated. For Geneious, one replicate was aligned to the reference due to limited computing resources. Traditional alignment methods are highly compute-intensive. The reference unit is each genome pooled by weight. Results across replicates were very consistent, as we observe low CVs for abundance and total matches. We see that both platforms generally agree, though the types of analyses are vastly different. The ten-fold miniaturized Nextera XT process utilizing the Echo 525 Liquid Handler provides quality libraries for sequencing and analysis consistently across replicates and analysis methods. There is some variation likely associated with the enzymatic chemistries in the process. Not all sequences will be fragmented and amplified at the same rate; GC content is a major consideration
Table 2 breaks down both analyses by sample and organism. The reference percentage is based on each genome pooled by weight. The Abundance metric refers to the percentage of reads identified to a particular organism out of the total reads, which should correlate directly with the reference as amount of genome (by weight) included in the sample. Total Match is a measure of how much of the reference genome was covered by the reads and can be used as a proxy for physical coverage of a genome. For CosmosID analysis, all four replicates were averaged, and CVs calculated. This was possible due to the powerful cloud platform that CosmosID has built, and the analysis took only 30 minutes. For Geneious traditional alignment analysis, only one replicate per sample was compared to each reference genome. This process was computer-intensive and a limiting factor in our analysis. We see that both platforms generally agree, though the types of analyses are vastly different. Aligning to a reference genome is a straightforward mapping exercise that relies on the user already knowing what is in the sample, while CosmosID bioinformatics utilizes novel methods to efficiently discern organisms down to strain resolution, so a full comparison of the two is not appropriate. Rather, the point is the tenfold miniaturized Nextera XT process utilizing the Echo 525 Liquid Handler provides quality libraries for sequencing and analysis consistently across analysis methods. We see low CVs across replicates, indicating the miniaturized process and bioinformatics analysis are very consistent. Some variation from the reference percentage can likely be attributed to enzymatic chemistries in the process. Not all sequences will be fragmented and amplified at the same rate; GC content is a major consideration. Another complicating factor in analysis is that the names and species in a database are only as accurate as entered. For example, Propionibacterium acnes has an alias as Cutibacterium acnes. This prompted us to scrutinize microbiome databases and naming conventions, since that is not consistent across the industry yet.
Figure 4: CosmosID stacked bar graph in relative and log-scale of sample diversity. We see good consistency across all replicates.
Figure 5: CosmosID 3D Principal Component Analysis by frequencies. We see good clustering and strong relationship between replicates of any given sample.
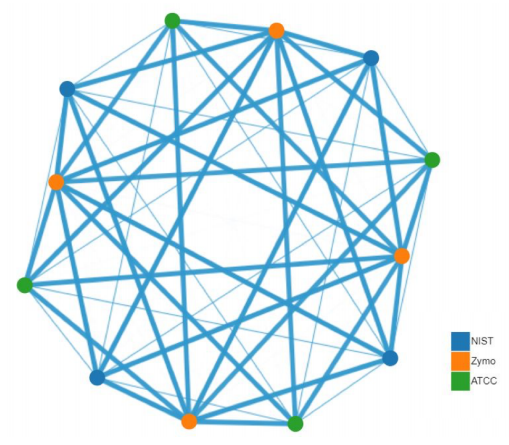
Figure 6: CosmosID Beta-Diversity network graph, Bray-Curtis dissimilarity method. The evenness of spacing between all data points demonstrates that the differences in species between samples (not replicates) is highly consistent.
CosmosID’s bioinformatics platform provided a plethora of analyses and data visualizations. Figures 4, 5, and 6 are products of their platform analysis. Using CosmosID’s cloud-based system allowed us to access powerful computing resources to analyze all our data in 30 minutes, then perform comparative analyses in minutes. We see that replicates of a given sample are highly consistent and result in the same answer. When using stacked bar graphs in relative and log-scale to visualize sample diversity, we see good consistency across all replicates. 3-dimensional principal coordinate analysis adds to this conclusion. And with the Bray-Curtis dissimilarity network graph, the evenness of spacing between data points indicates that the differences between types of samples is consistent.
Conclusion
Microbiome and metagenomic sequencing are gaining momentum as patient flora are increasingly linked to health implications. Within these communities lies a trove of information; for human health, pathogenicity, epitopes, and antibiotic resistances are key strain characteristics that can only be ascertained through whole-genome sequencing and appropriate analyses. For metagenomics, a wealth of enzyme sequences and analogues can be surveyed for a range of uses from finding novel catalytic ability to discovering a homologous enzyme that may use a different cofactor.
We demonstrated in this study that whole genome sequencing can be miniaturized ten-fold by utilizing the Echo 525 Liquid Handler. We see that the library and data produced sufficient reads for analysis and did not miss organisms. Replicates of each sample were highly consistent, reducing the need to increase sampling for statistical confidence. CosmosID’s bioinformatics tools allowed us to rapidly analyze the data with unrivaled accuracy. When this powerful bioinformatics platform is used in concert with the Echo 525 Liquid Handler, we can rapidly decrease the processing time from sample to answer and liberate the scientist’s time. Pairing these tools together allows researchers to expand and accelerate projects and developments in the microbiome field in the most efficient manner.
Materials
| Equipment | Manufacturer |
| Echo 525 Liquid Handler | Beckman Coulter Life Sciences |
| Allegra X-14 Centrifuge | Beckman Coulter Life Sciences |
| MixMate | Eppendorf |
| Qubit | Thermo Fisher |
| TapeStation 2200 | Agilent |
| BMG PHERAstar | BMG Labtech |
| ProFlex PCR System | Thermo Fisher |
| 384-well Post Magnet Plate | Alpaqua |
| MiSeq | Illumina |
| Reagents | Manufacturer | Part Number |
| Nextera XT DNA 96-Sample Prep Kit | Illumina | #FC-131-1096 |
| Nextera XT Index Kit v2 Set A | Illumina | #FC-131-2001 |
| PhiX Control v3 | Illumina | #FC-110-3001 |
| TapeStation D1000 HS Kit | Agilent | #5067-5584, #5067-5585 |
| Qubit dsDNA HS Assay Kit | Thermo Fisher | #Q32851 |
| Quant-iT Picogreen dsDNA Assay Kit | Thermo Fisher | #P11496 |
| Agencourt AMPure Beads | Beckman Coulter Life Sciences | #A63881 |
| 200 Proof Ethanol | Sigma Aldrich | #E7023 |
| MiSeq Reagent Kit v3 (150-cycle) | Illumina | #MS-102-3001 |
| Consumables | Manufacturer | Part Number |
| 384-well PP Microplate | Beckman Coulter Life Sciences | 001-14555 |
| 384-well LDV Plus Microplate | Beckman Coulter Life Sciences | 001-12782 |
| TapeStation Plate | Agilent | #5067-5150 |
| Qubit Microtube | Thermo Fisher | #Q32856 |
| 384-well PCR Plate | Bio-Rad | #HSP3805 |
| 384-well Black Flat Clear-Bottom Microplate | Greiner | #781096 |
| 1.5 mL DNA LoBind Tubes | Eppendorf | #022431021 |


