Cell Counting Performance of Vi–Cell BLU Cell Viability Analyzer

Bead and Cell Counting Data Comparisons
Sample materials utilized
6602796 (lot 9747455F) Coulter CC L10 Standard, nominal 10 μm, Latex Particle (NIST Traceable), 1 x 15 mL
Cell Type Profile: BCI L10 Beads
Instrument Settings for Bead Analysis
| Cell Type Profile | BCI L10 Beads |
| Minimum Diameter (µm) | 5 |
| Maximum Diameter (µm) | 15 |
| Images | 100 |
| Cell Sharpness | 22 |
| minimum Circularity | 0.5 |
| Decluster Degree | Medium |
| Aspiration Cycles | 3 |
| viable Spot Brightness (%) | 50 |
| Viable Spot Area (%) | 1 |
| Mixing Cycles | 3 |
Data recorded as averages of 72 samples for each dilution from 3 replicate 96 well plates Control Bead Results Sample Type: L10 Size Beads Control (3 instruments with replicate plates)
Control Bead Results
Sample type: L10 Size Beads Control (3 instruments with replicate plates)
.png?h=550&w=750&rev=e404c91fe90741d29ead09983b0ecd47&hash=D38360A5EC973216808EB4CB1790CD4B)
Cell Counting Analysis
Instrument performance for Cell Counting was determined using standard cultured CHO cells. The cells were prepared following dilution guidelines outlined by NIST illustrated below and data analyzed using standard Mammalian Cell Type. Cell type parameters for the protocols are given below.
Instrument Settings for Cell Culture Analysis:
| Cell Type | Mammalian |
| Minimum Diameter (µm) | 6 |
| Maximum Diameter (µm) | 30 |
| Images | 100 |
| Cell Sharpness | 7 |
| Minimum Circularity | 0.1 |
| Decluster Degree | Medium |
| Aspiration Cycles | 3 |
| Viable Spot Brightness (%) | 55 |
| Viable Spot Area (%) | 5 |
| Mixing Cycles | 3 |
Cell Count Results
A dilution protocol of 8 serial dilutions of CHO cells was established to test cell counting performance over different concentration ranges. The lower range concentrations were 9 replicate plates were run on 3 Vi–CELL BLU instruments (3 plates per instrument). Higher concentration ranges were run as 3 sets of replicate samples of 10 tubes per dilution using the carousel due to limited sample availability
| Dilution |
Nominal Concentration (x10^6) cells/mL |
Nominal Concentration (x10^6) cells/mL |
| Low-Mid Range | Mid-High Range | |
| 100% | 5.50 | 13 |
| 80% | 4.40 | 10M |
| 60% | 3.30 | 8M |
| 50% | 2.75 | 6.5M |
| 40% | 2.20 | 5.2m |
| 30% | 1.62 | 3.9M |
| 20% | 1.10 | 2.6M |
| 10% | 0.55 | - |
Results

Figure Above: CHO Cells Low Concentration Range Dilution Series Data

Figure Above: CHO Cells High Concentration Range Data
Additional sample plates were run using a smaller range of dilutions to confirm the performance of the instruments. These were repeated 3 times within a 16 hr period using the same stock supply of cells run on the same instrument. During this period cell population increase is considered minimal and the source material for analysis effectively the same.
3 plates were run in triplicate on 3 different Vi–CELL BLU instruments (9 plates total, n=864 samples). The data below shows the average of 216 samples for each dilution.The data collected from these runs was subjected to an ANOVA analysis to determine the degree of variability between the runs and within each run across sample replicates. The results show no statistical significance (p value >90) between all runs, across all instruments.
| Dilution | Nominal Concentration (x10^6) cells/mL |
| 100% | 2 |
| 50% | 1 |
| 15% | 0.5 |
| 10% | 0.2 |

Figure Above: Dilution Series of CHO Cells, Multiple Replicates
Conclusions
The counting performance of the Vi–CELL BLU shows excellent linearity over several dilutions covering a range of 0.5M–15 Million Cells per mL. As expected cell counts below 0.5M cells per mL do show a higher variability due to low overall numbers of cells per image frame. Even so the variability remains within allowable limits (10%) for instrument performance. When using standard L10 size beads the variability in counts is significantly lower due to the more uniform nature of the sample material.Utilizing the recommended NIST protocol, the proportional dilution acts as an internal control for cell count ensuring that instrument is counting accurately across different cell concentration ranges. Correlation of the counts and concentration across dilutions has a R2 value of >0.99 showing a consistent counting performance across dilutions. It should be noted that the large number of samples it is possible to run on the Vi–CELL BLU also allows for increased confidence in the cell counts and for easier identification of anomalous results.
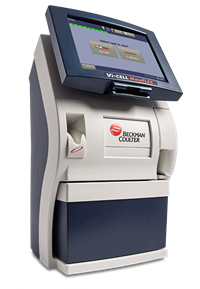
The Vi-CELL MetaFLEX and Vi-CELL BLU make a perfect pair. Discover the Vi-CELL MetaFLEX.
A cellular environment can change quickly. The Vi-CELL MetaFLEX is a bioanalyte analyser that quickly monitors changes in cell metabolic activity. It utilises thick film technology and miniaturised sensors to measure pH, pO2, pCO2, glucose, lactate, electrolytes and more parameters. All tests are carried out on just 65 μL of sample.


