Rapid, Automated Purification of Adeno-Associated Virus using the OptiMATE Gradient Maker
Introduction
Adeno-associated viruses (AAVs) are powerful delivery vectors for gene therapies.1 However, as AAVs assemble, they package nucleic acid cargo inefficiently, leading to only a small portion of viral particles carrying the gene of interest.2,3 Enrichment of these fully-loaded particles is a critical step in downstream purification workflows and is best accomplished by using gold standard Cesium Chloride (CsCl) density gradient ultracentrifugation (DGUC) methods.4 Although greater than 95% full AAV particles can routinely be achieved using CsCl-DGUC, run times for linear gradients in ultracentrifugation rotors are often 16 or more hours.5 This long run time can extend process time to 2-3 days, limiting throughput.

To address this fundamental challenge, we developed an automated solution called the OptiMATE Gradient Maker. This system is capable of dispensing linear gradients while incorporating large volumes of sample. Since lengthy DGUC run times are primarily due to the slow process of gradient formation, pre-formed linear gradients offer much faster separation. In the case of pre-formed gradients, run time is dictated largely by sample particle migration (and slight alteration in gradient profile based on run conditions). The OptiMATE Gradient Maker also eliminates hands-on steps in gradient preparation, providing high consistency, accuracy, and ease of use. In this application note, we demonstrate automated, high-resolution purification of full AAV capsids in just five hours. We also establish equivalency of critical quality attributes (CQAs) compared to the established manual ≥ 16-hour process.
Methods
Gradient Profiling
We first compared the density gradient profiles between tubes created by the OptiMATE Gradient Maker and tubes created manually (Figure 1). For this experiment, both 13.5 mL and 39 mL Quick-Seal Round-Top Ultra-Clear tubes were used to represent commonly used tube sizes and rotors for AAV purification.
The parameters used for density gradient profile generation are shown in Table 1. Methods were created on the OptiMATE Gradient Maker to dispense linear density gradients between pre-defined upper and lower limit densities (with an average tube density of 1.35 g/mL) using OptiMATE Cesium Chloride and nanopure water as the diluent. In parallel, tubes were manually filled with a homogeneous mixture of OptiMATE Cesium Chloride Solution and water to a starting density of 1.35 g/mL and sealed using a Cordless Tube Topper. The tubes were centrifuged in an Optima XPN-90 ultracentrifuge. The OptiMATE Gradient Maker-dispensed pre-formed linear density gradient tubes (hereafter referred to as pre-formed gradient tubes) were centrifuged for 4 hours while the homogeneous 1.35 g/mL density CsCl tubes (hereafter referred to as self-forming gradient tubes) were centrifuged for 20 hours to allow the density gradient to self-form. After centrifugation, the contents of the tubes were fractionated and recovered via bottom puncture. These fractions were analyzed using a refractometer to assess gradient profiles. To check for dispense variability, tubes dispensed by the OptiMATE Gradient Maker were fractionated immediately after dispense (without centrifugation) and analyzed using a refractometer.
| Parameter | 13.5 mL tubes | 39 mL tubes |
|---|---|---|
|
Total volume (mL) |
13.5 |
39 |
| Type tube | Quick-Seal Round-Top Ultra-Clear | |
| Rotor | 70.1 Ti | Type 70 Ti |
| Ultracentrifugation Speed (rpm) | 60,000 |
|
| Ultracentrifugation Speed (x g) | 329, 738 | 369, 548 |
| Average density (g/mL) | 1.35 |
|
| Upper limit density of pre-formed gradient (g/mL) | 1.2 | 1.14 |
| Lower limit density of pre-formed gradient (g/mL) | 1.5 | 1.56 |
| Approximate fraction sizes collected (mL) | 1.2 | 1.7 |
Table 1. Parameters for CsCl density gradient ultracentrifugation for self-forming (manual) and pre-formed gradients (OptiMATE Gradient Maker).

Figure 1. Scheme for density gradient control experiment comparing (a) automated dispense of a pre-formed CsCl gradient and (b) manual dispense of a self-forming CsCl gradient. Syringes represent bottom fractionation.
AAV Purification
AAV serotype 9 (AAV9) was expressed using triple transfection in HEK-293 cells. Following expression, cells were lysed, centrifuged, and the crude AAV was subjected to affinity chromatography for initial enrichment of all capsid species. This semi-purified material was used as the AAV sample for the experiment.
For both self-forming and pre-formed CsCl density gradients, OptiMATE Cesium Chloride was used, with the AAV sample as the diluent (Figure 2). 5 x 10¹³ viral genomes (vgs) of AAV were loaded per 13.5 mL tube and 1 x 10¹⁴ vgs of AAV were loaded per 39 mL tube. Care was taken to ensure that, despite differences in the preparation method for the pre-formed and self-forming density gradients, an equal amount of AAV was used per tube. The same process parameters used for the density gradient profile generation (Table 1) were used to prepare tubes for AAV purification. In this case, however, an ultracentrifugation run time of 5 hours was used for the pre-formed density gradient, as we expected that to yield sharper (less diffuse) bands. The entire process is detailed in Figure 2.
After centrifugation, the AAV full-capsid bands were extracted via side puncture and the recovered material was buffer exchanged into 1x PBS + 0.01% Poloxamer 188. The quality of the separation was assessed by checking for full capsid purity in the recovered sample using the Optima Analytical Ultracentrifuge (AUC) with absorbance at 230 nm.

Figure 2. Scheme for AAV purification comparing (a) automated dispense of a pre-formed CsCl gradient and (b) manual dispense of a self-forming CsCl gradient. The AAV sample is resolved into visible bands (empty capsids – blue; full capsids – red) at the end of the centrifugation run that are recovered by puncturing the tube from the side with a syringe and extracting the band.
Tube preparation process
Figure 3 describes a comparison of the effort and hands-on time involved in dispense of a linear CsCl gradient using the OptiMATE Gradient Maker compared to the manual approach. This schematic does not account for time taken for numerical calculations or the creation of the method, as these are one-time activities. It is also assumed that other material (like tubes) required for the experiment are kept ready for use. While the preparation of a CsCl self-forming gradient is not a laborious activity, there is nevertheless a 2-minute time (and 9-minute touch time) saving with the OptiMATE Gradient Maker. This difference, while minimal, can increase with increase size and number of tubes (with more than 2 tubes, the OptiMATE Gradient Maker will dispense and seal in parallel).
OptiMATE Gradient Maker

Manual Process

Figure 3. Schematic of CsCl continuous density gradient setup for 2 x 13.5 mL Quick-Seal tubes (a) manually or (b) using the OptiMATE Gradient Maker. Preparation steps are in light gray while dispense and seal steps are in dark gray.
Results
Density Profile
The quality of the dispensed pre-formed gradient can be observed in the gradient profile - a plot of density versus cumulative volume for fractions from tubes before centrifugation (Figure 4). Three different dispensed tubes showed strong overlap in terms of density distribution along the length of the tube and closely matched the targeted linear gradient. It is to be noted that some of the volume at the bottom of the tube (close to 1.5 g/mL density) could not be recovered due to limitations with the fractionation recovery method itself and is therefore not represented here. These curves demonstrate the high reproducibility and accuracy of the dispensing process by the OptiMATE Gradient Maker.

Figure 4. Comparison of gradient profiles from three tubes dispensed by the OptiMATE Gradient Maker.
The density gradient profiles for the dispensed tubes after centrifugation are shown in Figure 5. The profiles for the pre-formed gradients have a good overlap with the curves for the self-forming gradients after the ultracentrifugation run up to 1.4 g/mL density for both tube sizes (though there is more separation between the curves overall for the 39 mL tubes). The pre-formed gradients would therefore be expected to retain resolution in separating empty and full capsids despite having just 20% of the centrifugation time (4 hours vs 20 hours). It can be noted from Figures 4 and 5 that there is still some change to the density gradient profile between the dispensed pre-formed gradient tubes before and after ultracentrifugation. This especially leads to the difference in the gradient profile between the pre-formed and the self-forming gradient towards the bottom of the tube. This may not be a concern for the purification of full and empty AAV capsids but can potentially be improved by centrifuging the tubes for longer, if required. Additionally, in general, the less steep slope of the pre-formed gradient after the 4-hour run may allow pre-formed gradients to retain equivalent or better resolution than a self-forming gradient.
AAV Purification
The results of the purification of AAV samples by this established pre-formed and self-forming gradient profile are shown in Figure 6 and Table 2.

Figure 5. Comparison of gradient profiles from 13.5 mL Quick-Seal tubes (top) and 39 mL Quick- Seal tubes (bottom). Both plots have curves for OptiMATE Gradient Maker-dispensed preformed CsCl density gradient centrifuged for 4 hours (red) versus a manually-dispensed homogeneous CsCl density gradient that self-forms during a 20-hour centrifugation (black). Error bars are standard deviation. The blue and red bands represent the expected position range of the empty and full capsid bands.
Type 70.1 Ti

Type 70 Ti
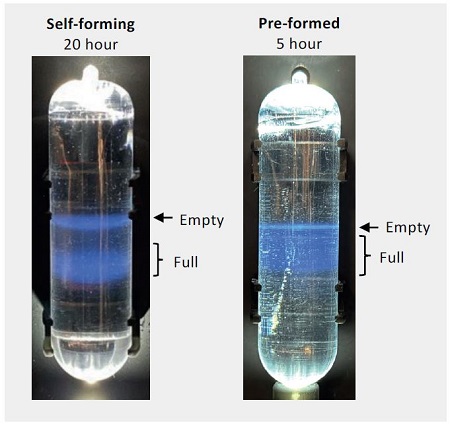
Figure 6. Representative images of AAV bands after ultracentrifugation from self-forming density gradients run for 20 hours and preformed density gradients run for 5 hours in 13.5 mL tubes (left) and 39 mL tubes (right).
There are differences in the band profiles between the self-forming density gradient tubes and the pre-formed density gradient tubes, particularly in the spread (i.e., sharpness) of the partially-filled and full-capsid bands, as well as the separation between these bands and the empty capsid band. However, the degree of separation between the empty capsid band and the full capsid bands is still adequate for visual observation and recovery by syringe puncture and extraction. This recovered material was checked for purity by AUC (Figure 7). The c(s) plots from the AUC analysis were integrated to determine the percentage of full capsids in the purified fraction.
Based on the observed full-capsid purification efficiency from Table 2 (> 90% full in both pre-formed and selfforming density gradients), the pre-formed density gradient can achieve equivalent purity of vg-filled capsids in a significantly shorter ultracentrifugation run time of 5 hours, representing a conservative time-savings of 75%. With more optimization of pre-formed density gradients, improved visual separation of empty, partially-filled and full capsids can be achieved.
Conclusion
One of the key pain points that the OptiMATE instrument addresses with linear gradients is the ultracentrifugation run time. A pre-formed gradient enables shorter run times, allowing for faster yet still efficient purification of material, as the gradient no longer relies on g-force to form. This reduction in run time can potentially shorten a 2-3 day purification process to a single-day operation, facilitating better scale-up of the purification process. Additionally, the reduced setup time minimizes operator touch-time, increasing overall efficiency.
In this study we demonstrated equivalence of AAV purity in a fraction of the time using the OptiMATE Gradient Maker. However, users are encouraged to conduct their own optimization studies, as we believe the times savings realized can be greater in some cases with different OptiMATE methods that are specific to their individual hardware and consumable configurations.
Type 70.1 Ti
Type 70 Ti
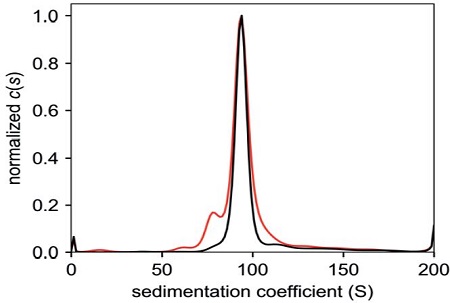
Figure 7. C(s) plots of AUC data of full capsid fractions from the pre-formed density gradient (red) and self-forming density gradient (black) show no significant peaks for empty particles for both 13.5 mL tubes (left) and 39 mL tubes (right).
| Tube size (mL) | Sample | % Full capsids (by AUC) |
|---|---|---|
| 13.5 | Pre-formed density gradient (5 hrs.) | 91.21 ± 2.11% |
| Pre-formed density gradient (20 hrs.) | 90.66 ± 2.54% | |
| 39 | Pre-formed density gradient (5 hrs.) | 93.58% |
| Pre-formed density gradient (20 hrs.) | 93.80% |
Table 2. Analysis of recovered AAV2 purity after centrifugation. Error values were calculated for the 13.5 mL with n=3 data while no error bars were calculated for the 38 mL tubes (n=1).
Considerations to port existing manual CsCl protocols to the OptiMATE Gradient Maker
- Note the density of the homogeneous CsCl solution used in the existing protocol. Run the existing CsCl protocol (the sample may be substituted with buffer) and collect fractions of the contents of the tube after centrifugation. Identify the density of the fractions. This can be measured directly or by measuring refractive index (RI) with a refractometer and converting to density using the equation - Density = (RI - 1.2388)/0.0946) (derived from international critical tables).6
- Plot the gradient profile using this density data to get the lower and upper limits of the density gradient. The upper limit of the density gradient can be extrapolated by fitting the linear part of the curve and extr the density at the bottom of the tube, as the profile tends to curve upwards in a non-linear fashion towards the bottom of the tube. It may not be necessary to match this non-linear section exactly.
- Pick a target lower and upper limit for the pre-formed gradient to be generated by the OptiMATE Gradient Maker that are close to the lower and upper limits estimated from the gradient profile of the self-formed gradient in the existing protocol. It is useful to ensure that this target lower and upper limit are equidistant from the density of the homogeneous CsCl solution used in the existing protocol. In other words, the average density of the pre-formed gradient should be the density of the homogeneous CsCl solution used in the existing protocol. This allows for the bands to appear at a similar location in the tubes as in the existing CsCl protocol.
- When creating the method of the OptiMATE Gradient Maker, select linear distribution and use the upper and lower limits picked as the target densities to create the method.
- If successfully created, this method should allow the generation of pre-formed CsCl gradients that allow for faster centrifugation times.
References
- Wang, Jiang-Hui, et al. “Adeno-Associated Virus as a Delivery Vector for Gene Therapy of Human Diseases.” Signal Transduction and Targeted Therapy, vol. 9, no. 1, Apr. 2024, pp. 1–33
- Mietzsch, Mario, et al. “Improved Genome Packaging Efficiency of Adeno-Associated Virus Vectors Using Rep Hybrids.” Journal of Virology, vol. 95, no. 19, pp. e00773-21
- Wright, J. Fraser. “Product-Related Impurities in Clinical-Grade Recombinant AAV Vectors: Characterization and Risk Assessment.” Biomedicines, vol. 2, no. 1, Mar. 2014, pp. 80–97 4.
- Nascimento, André, et al. “Purification of AAV8 through a Scalable Two-Step Monolithic Chromatography Approach.” Journal of Chromatography A, vol. 1740, Jan. 2025, p. 465586
- Strobel, Benjamin, et al. “Comparative Analysis of Cesium Chloride- and Iodixanol-Based Purification of Recombinant Adeno-Associated Viral Vectors for Preclinical Applications.” Human Gene Therapy Methods, vol. 26, no. 4, Aug. 2015, pp. 147–57
- International Critical Tables of Numerical Data, Physics, Chemistry and Technology. National Academies Press, 1930
| Item Description | Part Number |
|---|---|
| Quick-Seal Round-Top Ultra-Clear Tube, 13.5 mL | 344322 |
| OptiMATE Cesium Chloride Solution | D01357 |
| Quick-Seal Tube Topper Kit (50 Hz) |
358314 |
| Type 70.1 Ti rotor | 342184 |
| Type 70 Ti rotor | 337922 |
| Optima XPN-90 | A99842 |
| Optima AUC | B86437 |

