Using Standardized Dry Antibody Panels for Flow Cytometry in Response to SARS-CoV2 Infection
Authors, R Bowers1 , Giulia Grazia2, Michael Kapinsky3, Vashti Lacaille4, Anis Larbi5
1Beckman Coulter, Indianapolis, IN, 2Beckman Coulter, Cassina de’ Pecchi, Italy, 3Beckman Coulter GmbH, Krefeld, Germany, 4Beckman Coulter, Miami, FL, 5Beckman Coulter, Villepinte, France
Introduction
In order to identify early indicators of disease severity in SARS-CoV2-infection, the proportions of well-established immune cell phenotypes have been subject to extensive research, utilizing flow cytometry as a core technology1-3. In order to ensure comparable and consistent results in the massively multi-institutional research setting of a global pandemic, the use of standardized antibody panels and procedures, as demonstrated by The ONE Study4-6, is a promising approach that also can lower technical barriers.
Aim
As a highly standardized reagent set for comprehensive immune profiling, dry DURAClone* antibody panels (Beckman Coulter) were extended by adding antibodies in liquid format and evaluated for their utility as straightaway immune profiling research tools in normal and SARS-CoV2-positive donors.
Method
Samples
Cryopreserved PBMCs from
- COVID 19 negative healthy donors (n=4)
- COVID 19 positive donors with different degree of symptoms: Asymptomatic (n=2), Mild (n=2), Moderate (n=1), Severe (n=2)
Antibody panels
Panel#1: DURAClone IM Phenotyping Basic*
Drop-ins HLA-DR-PacBlue, CD123-PC5.5
| 405 nm | 488 nm | 561 nm | 638 nm | 808 nm | ||||||
| HLA-DR-Pacific Blue | CD45-Krome Orange | CD16-FITC | CD56-PE | CD19-ECD | CD123-PC5.5 | CD14-PC7 | CD4-APC | CD7-A800 | CD3-APC-A750 | ViaKrome 808 FVD |
Panel#2: DURAClone IM T cell subsets*
Drop-ins CD31-BV605, CD25-BV650, CD127-BV785
| 405 nm | 488 nm | 561 nm | 638 nm | 808 nm | |||||||||
| CD57-Pacific Blue | CD45-Krome Orange | CD31-BV605 | CD25-BV650 | CD127-BV785 | CD45RA-FITC | CD197-PE | CD28-ECD | CD279-PC5.5 | CD27-PC7 | CD4-APC | CD8-A700 | CD3-APC-A750 | ViaKrome 808 FVD |
Panel#3: DURAClone IM B cells*
Drop-ins CD25-PC5.5, CD71-APC-A700
| 405 nm | 488 nm | 561 nm | 638 nm | 808 nm | ||||||
| IgM-Pacific Blue | CD45-Krome Orange | IgD-FITC | CD21-PE | CD19-ECD | CD25-PC5.5 | CD27-PC7 | CD24-APC | CD71-APC-A700 | CD38-APC-A750 | ViaKrome 808 FVD |
Workflow
Results
The DURAClone IM Phenotyping Basic* panel provides an overview of lymphocytes and monocytes subpopulations in healthy donors (HD) and COVID-19 positive patients.
Figure 1. A) Overlay of manual gates on a viSNE map (Cytobank*) highlighting major cell subsets identified by staining of DURAClone tubes in PBMC from a healthy donor and four COVID-19 positive patients with different degrees of disease severity. B) Relative % of non-classical (CD14-CD16+), Classical (CD14+CD16-) and Intermediate (CD14+CD16+) monocytes in healthy donors and asymptomatic individuals compared to symptomatic COVID-19+ patients. viSNE was run on 9 population-defining markers with default settings.
The DURAClone IM T Cell Subsets* panel allows the delineation of maturation stages of T cells, covering naïve, effector, memory and terminal differentiation stages
Figure 2. A) Overlay of FlowSOM-identified metaclusters on viSNE maps (Cytobank*) for a healthy donor (HD) and a COVID-19 positive patient with severe disease. B) Heatmap visualization of marker expression by FlowSOM metacluster. Data was compensated and logicle transformed using Kaluza Analysis Software* and uploaded to the Cytobank platform through the Kaluza* Cytobank Plugin. viSNE was run on 12 population-defining markers with default settings. FlowSOM was used with hierarchical consensus clustering. C) Sunburst plots (Cytobank) are used to display hierarchical relationships of manual gates in two representative samples.
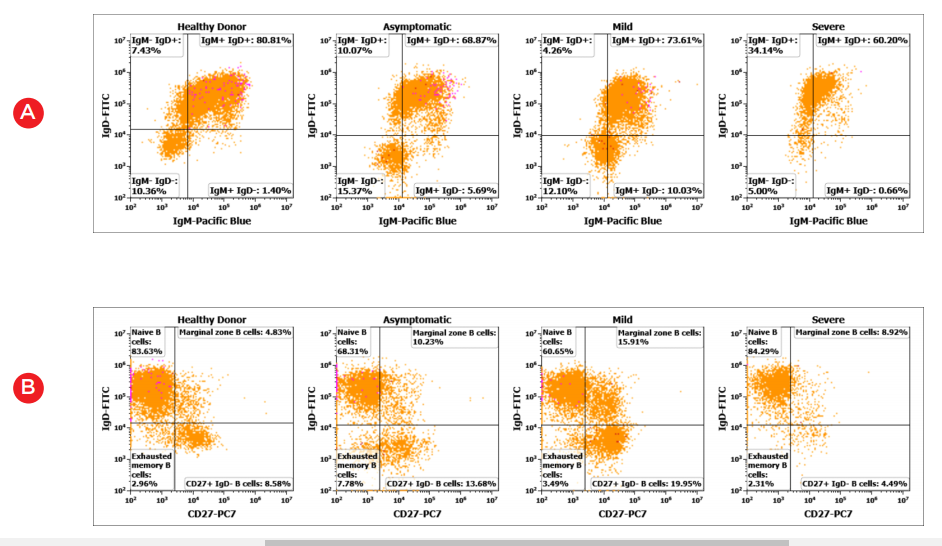
The DURAClone IM B Cell* panel allows for identification of late maturation stages of B cells, such as transitional stage, isotype class-switch, naïve and memory stages.
Figure 3. Representative bivariate histogram plots showing B-cell subpopulations (A) class-switch by IgM/IgD (B) Naive/memory stages by CD27/IgD (C) class unswitched memory B cells and (D) class switched memory B cells and plasmablasts in healthy and COVID19 positive donor PBMC samples.
Conclusions
- The DURAClone IM antibody panels Phenotyping Basic, T Cell Subsets and B Cell (all RUO*) allow for straightaway standardized immune profiling for research purposes, including flexible antibody additions.
- In this research context, cryopreserved healthy and SARS-CoV-2-positive samples revealed marked differences by manual population gating as well as by unsupervised analysis (non-significant, small n).
- The dry DURAClone* reagent format reduces sources of human error, thus ensuring observed differences are due to biological variation as opposed to inconsistent staining protocol execution.
References
- Cossarizza A et al. SARS-CoV-2, the Virus that Causes COVID-19: Cytometry and the New Challenge for Global Health. Cytometry A. 2020;97(4): 340-343.
- Schulte-Schrepping J et al. Severe COVID-19 Is Marked by a Dysregulated Myeloid Cell Compartment. Cell. 2020;182(6):1419-1440
- Mathew D et al. Deep immune profiling of COVID-19 patients reveals distinct immunotypes with therapeutic implications. Science. 2020;369(6508)
- Streitz M et al. Standardization of whole blood immune phenotype monitoring for clinical trials: panels and methods from the ONE study. Transplant Res. 2013;2(1):17.
- Kverneland AH et al. Age and gender leucocytes variances and references values generated using the standardized ONE-Study protocol. Cytometry A. 2016;89(6):543-564.
- Sawitzki B et al. Regulatory cell therapy in kidney transplantation (The ONE Study): a harmonised design and analysis of seven non-randomised, single-arm, phase 1/2A trials. Lancet. 2020; 395(10237):1627-1639.
Contact information
For questions on:
- Data acquisition and manual population analysis, please contact Rita Bowers at rbowers@beckman.com
- Unsupervised data analysis & Cytobank, please contact Giulia Grazia at GGRAZIA@beckman.com
- DURAClone* antibody panels, please contact Michael Kapinsky at mkapinsky@beckman.com
For Research Use Only. Not for use in diagnostic procedures.


