Automating the Valita Aggregation Pure Assay on a Biomek i-Series Liquid Handler
Product Information
The Valita Aggregation Pure assay, powered by automation via integration with a Biomek i7 liquid handler and a BioTek Cytation 1 Cell Imaging multimode reader (Agilent) (Figure 1), enables high-throughput, rapid, precise and accurate protein aggregation detection and quantification to streamline your clone selection process during antibody therapeutic development, stability studies, formulation assessment and or/manufacturing.
This automated analysis provides:
- High-throughput capability: 456 samples normalized, measured and analyzed in < 2 hours
- Rapid method execution: up to 100% walkaway time
- Consistent accuracy and reproducibility of results compared to the manual method
- Reduced manual errors and hands-on time
- Data analysis performed automatically
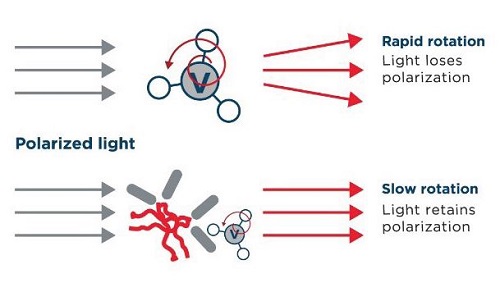
Figure 1. Biomek i-Series Liquid Handling System integrated with a BioTek Cytation 1 Cell Imaging Multimode Reader (Agilent), which creates a seamless flow of data and results analysis.
In this application note, the Valita Aggregation Pure assay is used with various aggregated IgG samples and benchmarked against SEC-HPLC analysis (Table 1).
| Analysis Attribute |
SEC-HPLC | Valita Aggregation Pure |
|---|---|---|
| Assay throughput | 2 samples per hour | 5x96-well plates per hour |
| Complete assay time | 49 injections - 25 hours | 480 samples in 1 hour |
| Manual data interpolation | 49 injections - 1 h 45min | None |
| Standard deviation | ≤ 1 % HMWS | ≤ 1 % HMWS |
| Trending/ranking | Same rank order of 6 different % HMWS IgGs | |
Table 1. Benchmarking of the automated Valita Aggregation Pure assay versus aggregate quantitation by SEC-HPLC. Higher Molecular Weight Species abbreviated to HMWS.
Introduction
Therapeutic antibodies are the most dominant class of biological drugs developed in recent years. Since the first monoclonal antibody (mAb) was approved by the United States Food and Drug Administration (US FDA) in 1986, rapid evolution of the industry has led to antibodies becoming the best-selling drugs in the pharmaceutical market.1 In 2023, 20 mAbs were FDA approved,2 with numerous candidates currently under development or in clinical phases. The global biologics market was estimated to be worth over $450 billion in 2022, with an expected annual growth rate of 10% until 2031.3
The laborious process for antibody development and production is under constant improvement to help pharmaceutical companies reduce time and costs of target molecule production—while increasing yields and maintaining an appropriate drug safety profile. Automation enables a drastic reduction in manual intervention leading to a less error-prone and less time-consuming process. Hence, creation of robust automated development and manufacturing platforms is key for antibody drug development efforts for biopharma companies that want to seamlessly translate target molecules into clinical and commercial successes.
Throughout mAb development, scientists are focused not only on product quantity, but also product quality, via rigorous monitoring of critical quality attributes (CQAs). Product aggregation is considered a key CQA in the biologics industry, as elevated aggregation levels negatively impact both product stability and safety profiles. Pharmaceutical companies dedicate significant time and resources to monitoring and minimizing levels of aggregation in their target molecules. While current techniques such as SEC-HPLC offer accurate and reliable measurement of aggregation in mAbs, they can be time consuming, with large CAPEX requirements and limited opportunities for automation integration impacting the ability of companies to scale their screening capabilities.
Here we provide an overview of a fully automated IgG aggregation screening platform that enables rapid and high-throughput measurement, evaluated alongside the current gold standard technique, Size Exclusion Chromatography (SEC).
The Valita Aggregation Pure assay measures protein aggregation with a simple add, mix, read protocol. This assay uses fluorescence polarization (Figure 2), a technology that leverages a fluorescently labelled, target-specific probe that can bind to aggregated protein molecules, providing a direct change in fluorescence output respective of protein aggregation quantity. As demonstrated in this document, the assay supports high-throughput analysis and can be fully automated (assay features are reported below in Table 2). Assay detection can be performed using fluorescence polarization on any high performance multimode microplate reader.

Figure 2. The fluorescence polarization principle used in the Valita Aggregation Pure assay. A small, unbound fluorescently labeled protein will rotate rapidly in solution, emitting de-polarized light when excited by plane polarized light (top). A fluorescently labeled protein, bound to a larger molecular complex (e.g., aggregated IgG) will rotate slowly, increasing the retention of polarized light (bottom). This difference in light polarization between bound and unbound protein provides a quantitative output of the target molecule concentration in solution.
The Valita Aggregation Pure assay uses a simple add, mix, read protocol which makes it well-suited for high-throughput aggregation analysis using liquid handlers such as the Biomek i5 or i7 systems, or other liquid transfer devices. In this case, to automate the Valita Aggregation Pure assay, a method was developed on the Biomek i7 liquid handling system, integrated with a fluorescence polarization-configured BioTek Cytation 1 Cell Imaging multimode reader (Agilent). This workflow supports the presentation of samples of interest to the Biomek i7 deck, followed by automatically performed liquid transfers (including standard curve preparation and sample concentration normalization), incubations, plate transfers and data analysis (Figure 3).
The solution presented here demonstrates the quantification of up to 176 samples (2 x 96-well plates) within 1 hour, with the presentation of a readily interpolated, direct output of IgG aggregation results.

Method applicable to Valita Aggregation Pure Analytics
Figure 3. Overview of the Valita Aggregation Pure assay workflow powered by Biomek i7 automation and integration of a BioTek Cytation 1 Cell Imaging multimode reader (Agilent).
These automated assays demonstrate the increased speed of aggregated IgG screening while maintaining precision and accuracy of results.
Product Features
| Product Features | Benefits | |
|---|---|---|
|
|
|
|
|
|
|
|
BioTek Cytation 1 (Agilent)
|
Multimode detection module available:
|
|


Table 2. Product features and benefits of the technologies used for IgG aggregation screening method demonstration.
Analytical Methods
Stressing of IgG Material
Monomeric IgG material was stressed at a low pH to induce aggregation. Once the IgG material had demonstrated > 30% high molecular weight species (HMWS), as assessed through size exclusion
chromatography (SEC), this was stored at -80°C until use. Prior to assay use, the sample was diluted with monomeric IgG of the same protein concentration to yield a 30% HMWS reference standard (Figure 4).

Figure 4. IgG is stressed using low pH to induce aggregation and the production of HMWS material. The percentage of HMWS material is assessed through SEC-HPLC and later combined with monomeric IgG of the same parent molecule to provide an aggregation reference material of known % HMWS.
HPLC Analysis of IgG Material
An Agilent 1260 HPLC system was used for analysis of all samples with a Tosoh G4000SWxl (7.8 mm, 300 mm length) column. All samples were diluted to 1 mg/mL prior to analysis and injected at 5 μL. The mobile phase used was 200 mM Phosphate solution at pH 6.8. Run parameters are highlighted in Table 3.
| Parameter |
Condition |
|---|---|
| Flow | 0.6 mL/min |
| Run time | 30 minutes |
| Sample temperature | 4°C |
| Column temperature | 35°C |
| Wavelength | 280 nm with 360 nm reference |
Table 3. HPLC conditions used for determining the percentage of HMWS.
Assay Performance Using a Biomek i-Series Workstation
System Set-Up
Once all samples and standards were plated in 96-well format, the Biomek i-Series Workstation performed the Valita Aggregation Pure assay to determine the % HMWS of each sample submission.
Assay conditions (e.g., number of samples and plates) can be easily defined for the Valita Aggregation Pure assay using the Biomek Method Option Selector (MOS) as part of the Biomek software. When the user selects the Valita Aggregation Pure assay protocol from the Biomek software, the MOS allows the user to decide how many samples to run on their first plate, as well as how many supplementary plates to run in this assay occasion (Figure 5). The user also has the option to select for sample normalization if their samples are of different protein concentrations. With this option enabled, the Biomek i-Series will dilute all samples to the same protein concentration as directed by the user submitting a .csv file.
A final tick box enables the Biomek i7 Workstation to perform the Valita Aggregation Pure assay with a choice of top aggregation standard that is most suitable to the range that the user needs. This will determine the standard curve and integration used for automated results generation on completion of the assay run. In this instance, the 30% aggregated top standard was selected. For best performance of the assay, users should aim for a top standard of ≥ 20% wherever possible, to facilitate a broad measurement range.

Figure 5. The Biomek MOS provides flexibility to users in how they will run their assay. These options allow users to select the number of samples or plates analyzed, whether sample normalization is needed, and range of the standard curve.
Assay Performance
Once all selections have been made and the assay is instructed to start, the user will be directed by the Biomek Guided Setup to add all the necessary consumables to the deck, including reagents and volumes necessary. At this point, all manual interactions are complete, and the automated Valita Aggregation Pure method is initialized. The assay is then performed as directed in Figure 6.

Figure 6. The Valita Aggregation Pure multi-plate workflow on the Biomek i7 liquid handling system. The user makes assay specific selections using the MOS. The Guided Setup directs the user in setting up the Biomek i-Series deck. The assay then proceeds through sample normalizations and standard curve preparation, followed by plating up the Valita Aggregation Pure plates, mixing, incubating and running them on the Cytation 1 plate reader.
Results Generation
The BioTek Gen5 software (Agilent) interpolates aggregation percentage values from the Valita Aggregation Pure plates automatically. This software uses the Biomek i-Series-prepared standards to generate a 3-polynomial standard curve against which fluorescence polarization values of each sample derive a % HMWS determination.
GraphPad Prism 10.4.0 was used to generate curves for this application note and are for illustrative purposes only. This software was also used to interpolate study 1B samples against the standard curve in study 1A.
Agilent’s OpenLab was used to manually integrate HPLC chromatograms and provide % HMWS output.

Figure 7. Plate layout of the analytical samples submitted to the Biomek i7 deck in this study. The samples covered a range of starting protein concentrations as well as various aggregation percentages of IgG.
Study 2: Performance of Full Assay (Standards and Samples Inclusive)
This assay used the full workflow involved in the previous studies. The Biomek i-Series Workstation performs:
- Generation of a 30% HMWS standard curve
- Normalization of samples to 1 mg/mL
- Transfer of samples and standards to the Valita Aggregation Pure assay plate
- Mixing of standards/samples
- Incubation
- Transfer to the BioTek Cytation 1 Cell Imaging Multimode Reader (Agilent)
- Fluorescence polarization reading of Valita Aggregation Pure assay plates with automated interpolation of samples for % HMWS content.
Results
Study 1A: Assessment of Aggregation Standard Curve Using 30% HMWS Material
Stressed IgG material that was diluted to approximately 30% HMWS was analyzed on SEC-HPLC to determine aggregation content (Figure 8). The aggregated standard was assessed to contain 34.2% HMWS, with the monomeric IgG material containing 1.4% HMWS.

Figure 8. Chromatograms of the aggregated and monomeric standards as assessed by SEC-HPLC for % HMWS.
These standards were used as high and low controls on the Biomek workstation to generate a standard curve that was measured using the Valita Aggregation Pure assay. The assay analysis, using fluorescence polarization returns a response in millipolarization (mP) units, which increases as more aggregated IgG is detected. From these mP values, a third order polynomial standard curve was generated with an R2 of 1.00 demonstrating strong linearity and tight corroboration between duplicates (Figure 9).
30% HMWS Human IgG Aggregation Standard Curve

| % HMWS | Rep 1 (mP) | Rep 2 (mP) |
|---|---|---|
|
34.2 |
92.9 |
93.6 |
| 23.2 | 69.2 | 67.2 |
| 12.3 | 36.4 | 35.7 |
| 6.8 | 19.4 | 19.4 |
| 4.1 | 13.8 | 12.6 |
| 3.0 | 10.2 | 9.5 |
| 1.4 | 7.7 | 6.7 |
Figure 9. Standard curve as performed by the BioTek Cytation 1 Cell Imaging Multimode Reader (Agilent) using an approximate 30% HMWS range. Standard error bars represent the standard deviation of the mean. Individual millipolarization (mP) values based on fluorescence polarization recorded for each standard are displayed in the table.
Study 1B: Assessing Samples of Varying % HMWS Against the Aggregation Standard Curve
Characterized material was this time used to produce samples of various amounts of aggregation and at varying protein concentrations. These samples were expected, based on dilutions, to contain 27, 23, 18, 14, 9 and 4% HMWS. They were also presented to the Biomek workstation at protein concentrations of 4, 3, 2, 1.5, 1.2 and 1 mg/mL. This produced 36 different sample types for analysis (Figure 7).
A representative of each of these 36 sample types was analyzed by SEC-HPLC to gauge aggregation content (Figure 10) and confirm appropriate differences in % HMWS between the samples.

Figure 10. Overlay of HPLC chromatograms representing the 1 mg/mL samples at the 6 different aggregate concentrations. Left image: full analysis chromatograms. Right image: aggregate peak areas zoomed in.
For analysis on the Valita Aggregation Pure assay, samples were normalized to the same concentration. This normalization was facilitated by the Biomek workstation after two 96-well plates, containing 176 samples covering the 36 different protein and aggregation concentrations, were submitted to the deck.
Once samples were normalized to 1 mg/mL, the Biomek workstation proceeded directly to performing the Valita Aggregation Pure assay, automating aggregation analysis supported by the integrated BioTek Cytation 1 Cell Imaging Multimode Reader (Agilent).
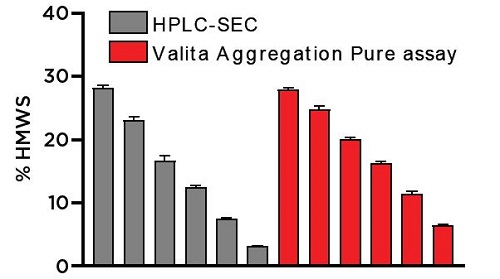
Aggregation determinations were averaged for each sample preparation and were plotted against their respective HPLC values (Figure 11). As differentials in protein concentration can affect the fluorescence polarization output on the Valita Aggregation Pure assay, this data showed the ability of the Biomek i-Series Workstation to normalize samples of varying protein concentrations to a specified concentration as exemplified by the high precision (CV) on each sample set. The Valita Aggregation Pure assay demonstrated an equivalent ranking proficiency as the HPLC from interpolated % HMWS, with samples trending from most to least aggregated. The precise resolution demonstrated here enables users to easily and rapidly identify samples of different aggregation profiles.
Samples of Different Aggregations Measured by HPLC and Valita Aggregation Pure
| Expected % HMWS |
Agg Pure % HMWS |
Standard Deviation (%) |
CV (%) |
|---|---|---|---|
|
27 |
27.8 |
0.4 | 1.5 |
| 23 | 24.8 | 0.5 | 2.2 |
| 18 | 20.0 | 0.3 | 1.5 |
| 14 | 16.3 | 0.2 | 1.3 |
| 9 | 11.4 | 0.4 | 3.3 |
| 4 | 6.4 | 0.2 | 3.6 |
Figure 11. Bar graph summarizing the SEC-HPLC and Valita Aggregation Pure assay determinations of % HMWS in the IgG samples assessed in Study 1B. The table (right) displays the averaged aggregation results as determined by the Valita Aggregation Pure assay.
Study 2: Performance of Full Assay (Standards and Samples Inclusive)
The combination of the previous studies demonstrate how the Valita Aggregation Pure assay can be used to fully quantify protein aggregated material. This assay used characterized aggregate and
monomeric standards to once again set up samples of different % HMWS and different starting protein concentrations (the same as in Study 1B). The 36 sample types were submitted to the Biomek
workstation across two 96-well plates, accommodating 176 individual tests. An IgG standard diluted to 30% HMWS and a monomeric standard determined to have 1% HMWS were loaded to the deck for standard curve generation. The Biomek workstation proceeded to generate a 30% HMWS standard curve and normalized samples, and ran the Valita Aggregation Pure assay plates on the integrated BioTek Cytation 1 Cell Imaging Multimode Reader (Agilent).
A standard curve was generated demonstrating strong linearity (R2 value of 0.995) as shown in Figure 12. The samples were automatically interpolated off this standard curve using the BioTek Gen5 software (Agilent).
30% HMWS Human IgG Aggregation Standard Curve

Figure 12. Standard curve generated using the 30% HMWS aggregated and monomeric IgG standards. Standard error bars represent the standard deviation of the mean. Outlying data point omitted for the 5% standard.
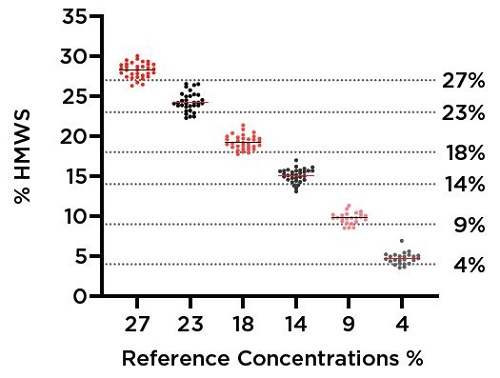
Every individual sample value determined from this assay is plotted in Figure 13. The mean value and variation determined for each % HMWS, as detected by the Valita Aggregation Pure assay following normalization and measurement at 1 mg/mL, is presented in table format. Note that despite the high number of replicates (24 or 32 replicates per % HMWS sample) and variation in protein concentration prior to normalization by the Biomek (see Figure 7), the standard deviations were kept roughly within 1% HMWS. Recoveries were also all within 1.3% HMWS from their expected values. This is indicative of both precise normalization by the Biomek workstation and uniform detection of HMWS by the Valita Aggregation Pure assay, with all samples successfully returning values with strong alignment to their predicted values.
Samples of Different Aggregations Measured by Valita Aggregation Pure
| Expected % HMWS |
Agg Pure % HMWS |
Standard Deviation (%) |
CV (%) |
|---|---|---|---|
|
27 |
28.2 |
0.9 | 104.6 |
| 23 | 24.3 | 1.2 | 105.6 |
| 18 | 19.2 | 0.9 | 106.9 |
| 14 | 15.1 | 0.8 | 107.8 |
| 9 | 9.8 | 0.7 | 108.7 |
| 4 | 4.7 | 0.7 | 118.6 |
Figure 13. Scatter plot representing all 176 individual sample results from the Valita Aggregation Pure assay. Dotted lines demonstrate anticipated values of interpolation, based on dilutions of IgG standards. Solid lines represent the averages of each expected % HMWS sample grouping. The table provides the average values, variability and expected recovery for each sample subset based on their expected % HMWS from dilution at the start of the assay.
Conclusion and Summary
This set of work presents an example of how the Valita Aggregation Pure assay can be used with automation to facilitate simple, fast and reliable aggregation determination of IgG material. This workflow enables users to apply samples of various protein concentrations over a wide range of aggregation states to be analyzed over a short period of time without manual intervention. From the moment samples and standards were added to the Biomek i-Series Workstation deck, the 2-assay plate workflow was complete in under an hour, with the functionality of the method build allowing the submission of up to 5 plates. This provides the ability to normalize and measure hundreds of samples within a couple of hours.
As a benchmark of this workflow, SEC-HPLC, the current industry accepted gold standard technique for aggregation detection and measurement, was used to assess aggregated material in the initial phases of the studies. The data returned through the Valita Aggregation Pure assay yielded high precision with recovery within expectations for these sample sets.
While both assessment methods used in this work returned comparable results with respect to % HMWS recovery, the time to result for both analysis methods are profoundly different. In study 1B, 36 samples were analyzed via SEC-HPLC, with a time to result of approximately 20 hours (18.62 hours for sample assessment plus 1.35 hours for data analysis) versus the 180 samples that were normalized and analyzed using the automated Valita Aggregation Pure assay in 1 hour, analyzing 5 times more samples in 5% of the time required for the SEC-HPLC analysis. The automated Valita Aggregation Pure assay represents a significant opportunity to users to reduce assay timelines while maintaining accuracy of results compared to industry standard technologies. The assay can be scaled to normalize and analyze 456 samples in a single run in under 2 hours. Assay time can be be further reduced to under 1 hour if sample normalization is not required, ultimately enabling analysis of thousands of samples within a single day.

Figure 14. Comparisons of aggregation analysis workflow timings, based on study 1B. Steps that need manual input are highlighted in blue, whereas those featuring walk-away time are colored red. The bar chart highlights the total time accrued over the duration of the analyses.
In conclusion, this automated aggregation analysis provides users with an easily scalable high-throughput, aggregation workflow with almost 100% walkaway time. This method supplies highly reproducible results without significant system maintenance or data analysis, while enabling users to greatly reduce the number of samples requiring more in-depth analyses (SEC-HPLC). This tool supports rapid elimination of highly aggregated samples, contributing to best-quality clone selection at a quicker pace.
About Biomek i-Series Systems
Biomek i-Series liquid handling systems are designed for instrument integration, including the flexibility to interchange between Span-8 and multichannel pipetting, enhancing opportunities for high-throughput analysis. Labware integrations (e.g., plate readers, incubators, plate shakers, plate washers) into automation platforms can contribute to enhanced throughput efficiency, significantly reduced hands-on time and enhanced data quality of your workflows.
Biomek i-Series systems have demonstrated their accelerated efficiency and analytical value for biotherapeutic drug development and manufacturing. Application notes are available demonstrating Biomek-automated solutions for, but not limited to, rapid IgG quantification, determining residual Protein-A and HCP clearance and characterizing N-linked glycans.
About BioTek Plate Readers
The Agilent Cytation 1 Cell Imaging Multimode Reader provides modularity and upgradability, allowing diverse workflow and data analysis needs and can be readily integrated into the Biomek i7 workstation. BioTek multimode readers enable measurements of a range of imaging and plate-based assays, including Valita Titer, ELISA, growth, metabolic and enzyme kinetics. Integration of a BioTek Cytation 1 Cell Imaging Multimode Reader (Agilent) with the Biomek i7 workstation enables a seamless flow of analytics, data generation and analysis of results.
References
- Lu, RM., Hwang, YC., Liu, IJ. et al. Development of therapeutic antibodies for the treatment of diseases. J Biomed Sci 27, 1 (2020). https://doi.org/10.1186/s12929-019-0592-z
- https://www.opastpublishers.com/open-access-articles/therapeutic-monoclonal-antibodiesapproved-by-fda-in-2023.pdf
- https://www.grandviewresearch.com/industry-analysis/biologics-market
Materials and Reagents
Valita Aggregation Pure Assay Hardware
| Description |
Manufacturer |
|---|---|
| Biomek i7 Hybrid Automated Liquid Handler | Beckman Coulter Life Sciences |
| BioTek Cytation 1 Cell Imaging Multimode Reader | Agilent |
Valita Aggregation Pure Assay Labware and Consumables
| Part Number |
Description | Manufacturer |
|---|---|---|
| B85911 | BC190F Pipette tips | Beckman Coulter Life Sciences |
| B85955 | BC1025F Pipette tips | Beckman Coulter Life Sciences |
| 609844 | BCFlat96 96-well polystyrene clear plates | Beckman Coulter Life Sciences |
| D05092 | Valita Aggregation Pure 96-well plates | Beckman Coulter Life Sciences |
| 10565672 | Black universal microplate lids | Corning |
| 95040452 | Nunc 96-Well Deep Well Plates | Thermo Fisher Scientific |
| HSP9601 | White PCR plates with clear wells | BioRad |
| 201244-100 | 300 mL Reservoir | Agilent Technologies |
| HG4K | Human IgG4K | Sino Biological |
| SH30256.01 | Phosphate Buffered Saline | Cytiva |

