Automating the Valita Titer IgG Quantification Assay on a Biomek i-Series Liquid Handling System
Product Information
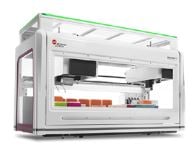
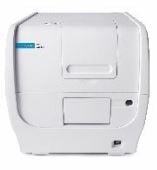
The Valita Titer assay, powered by automation via integration with a Biomek i7 liquid handling system and a BioTek Cytation 1 Cell Imaging Multimode Reader (Agilent) (Figure 1), enables high-throughput, rapid, precise and accurate IgG quantification to streamline your clone selection process.
This automated analysis provides:
- High-throughput capability: 480 samples measured in < 50 minutes
- Rapid method execution: up to 50% time reduction compared to a manual assay
- Consistent accuracy and reproducibility of results compared to the manual method
- Reduced analyst manual error
- Reduced analyst hands-on time and increased walkaway time

Figure 1. Biomek i-Series Liquid Handling System integrated with a BioTek Cytation 1 Cell Imaging Multimode Reader (Agilent), which creates a seamless flow of data and results analysis.
Introduction
Therapeutic antibodies are the most dominant class of biological drugs developed in recent years. Since the first monoclonal antibody (mAb) was approved by the United States Food and Drug Administration (US FDA) in 1986, rapid evolution of the industry has led to antibodies becoming the best-selling drugs in the pharmaceutical market.1 In 2023, 20 mAbs were FDA approved,2 with numerous candidates currently under development or in clinical phases. The global biologics market was estimated to be worth over $450 billion in 2022, with an expected annual growth rate of 10% until 2031.3
The laborious process for antibody development and production is under constant improvement to help pharmaceutical companies reduce time and costs of target molecule production—while increasing yields and maintaining an appropriate drug safety profile. Automation enables a drastic reduction in manual intervention leading to a less error-prone and less time-consuming process. Hence, creation of robust automated development and manufacturing platforms is key for antibody drug development efforts for biopharma companies that want to seamlessly translate target molecules into clinical and commercial successes.
In upstream processes, titer monitoring is the most important critical parameter used to select the best clones producing high quantities of mAb (e.g., IgG). An accurate and reliable real-time measurement of mAb titer is essential to rapidly adjust the process conditions for maximum protein output while minimizing process time. Quick access to titer data also enables earlier decisions regarding preparation of downstream processes, further reducing production timelines. Here we provide an overview of a fully automated IgG titer quantification platform that allows rapid, robust, and high-throughput measurement.
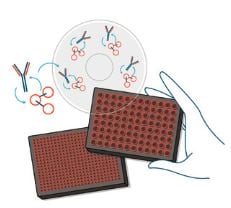
The Valita Titer and Valita Titer Plus assays measure IgG concentrations respectively in the range of 2.5 to 100 mg/L and 100 to 2000 mg/L, with a simple add-mix-read protocol. This assay uses fluorescence polarization (Figure 2), a technology that leverages a fluorescently labeled, target-specific probe that can bind to IgG molecules, providing a direct change in fluorescence output respective of IgG quantity. As demonstrated in this document, the assay supports high-throughput analysis and can be fully automated (assay features are reported below in Table 1). Assay detection can be performed using fluorescence polarization on any available multimode microplate reader.

Figure 2. The fluorescence polarization principle used in the Valita Titer assay. A small, unbound fluorescently labeled protein will rotate rapidly in solution, emitting de-polarized light when excited by plane polarized light (top). A fluorescently labeled protein, bound to a larger molecular complex (e.g., IgG) will rotate slowly, increasing the retention of polarized light (bottom). This difference in light polarization between bound and unbound protein provides a quantitative output of the target molecule concentration in solution.
To automate the Valita Titer assay, a method was developed on the Biomek i7 liquid handling
system, integrated with a fluorescence polarization (FP)-configured BioTek Cytation 1 Cell Imaging
Multimode Reader (Agilent). This workflow supports the presentation of samples of interest to the Biomek i7
deck, followed by automatically performed liquid transfers (including standard curve preparation),
incubations, plate transfers and data analysis (Figure 3).
The solution presented here demonstrates the quantification of up to 456 samples (5 x 96-well plates) in less than 50 minutes, with the presentation of a readily interpolated, direct output of IgG titer results.

Method applicable to Valita Titer and Valita Titer Plus Analytics
Figure 3. Overview of Valita Titer and Valita Titer Plus assay workflow powered by Biomek i7 automation and integration of a BioTek Cytation 1 Cell Imaging
Multimode Reader (Agilent).
These automated assays demonstrate the increased speed of automated IgG quantification while maintaining precision and accuracy of results.
Product Features
| Product Features | Benefits | |
|---|---|---|
|
|
|
|
|
|
|
BioTek Cytation 1 (Agilent)
|
Multimode detection module available:
|
|
Table 1. Product features and benefits of the technologies used for IgG quantification method demonstration.
Analytical Methods
Automated Valita Titer Assay
To demonstrate the ability of Valita Titer and Valita Titer Plus assays to accurately determine IgG quantity in an automated workflow, CHO media was spiked with known concentrations (15, 25, 35, 45, 55, 65, 75 and 85 mg/L) of IgG prepared in fresh CD-CHO media.
These samples were then applied evenly across 5 flat-bottomed 96-well plates in 120 μL volumes (12 technical replicates of each concentration were loaded in each plate, except for plate 1, where 10 technical replicates were applied to allow for a duplicate standard curve).
The sample plates were placed on the deck of a Biomek i7 workstation along with a reservoir of fresh CD-CHO media, the necessary pipette tips and the Valita Titer assay plates. A deep well plate with a single well containing a 1000 mg/L IgG stock was added for standard curve generation. At this point, all manual interactions were completed, and the automated Valita Titer assay method was initialized.
When a method is run on the Biomek workstation, the software allows the user to input parameters to facilitate specific functions of the workflow (Figure 4). A guided labware setup is presented to the user to direct the addition of all applicable materials and reagents to the instrument deck.
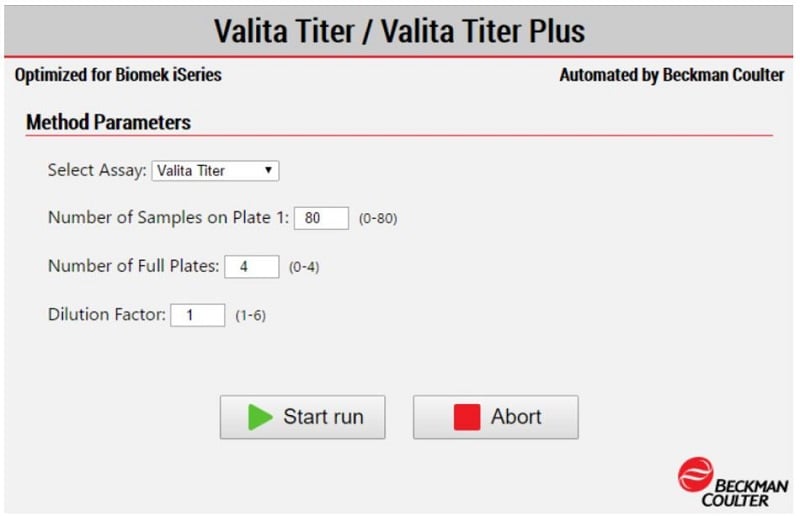
Figure 4. The Biomek Method Option Selector. Upon initialization of the Valita Titer assay or Valita Titer Plus assay method, the assay’s parameters are selected by the user. Options include selections for assay type, sample number, plate number and sample dilution.
The Biomek i7 workstation started the run by preparing a standard curve using the IgG stock in the deep well plate. IgG Standards of 0, 10, 20, 40, 50, 60, 80 and 100 mg/L were applied as duplicates to sample plate 1. Following the standard Valita Titer assay protocol, CD-CHO buffer (60 μL) was added to each well of the Valita Titer assay plates, followed by sample/standard addition (60 μL), mixing and incubation. After incubation at room temperature, plates were transferred to the Cytation 1 Cell Imaging Multimode Reader (Agilent), and an FP assay was carried out. An example of the automated method for testing 5 Valita Titer plates (456 samples) is represented in Figure 5.
Automated Valita Titer Plus Assay
The Valita Titer Plus assay was performed following the same Biomek method as with the Valita Titer assay, but with a few exceptions. Two plates were placed onto the deck in this instance, with 22 technical replicates for each IgG concentration of 300, 500, 700, 900, 1100, 1300, 1500 and 1700 mg/L. Standards were prepared from a 2000 mg/L IgG stock, placed onto the Biomek i7 deck in a single well of a deep well plate. The plates used for analysis were Valita Titer Plus assay plates.
The Biomek i7 automated method prepared standards at concentrations of 0, 100, 250, 500, 750, 1000, 1500 and 2000 mg/L IgG. The Valita Titer Plus assay plates were read after 15 minutes of incubation at room temperature.
Manual Valita Titer Assay
The same steps performed in the automated Valita Titer assay method were repeated manually for comparison. In this case 2 assay plates were assessed (22 technical replicates for each sample concentration). An example of the manual method for testing 5 titer plates (480 samples) is represented in Figure 5.
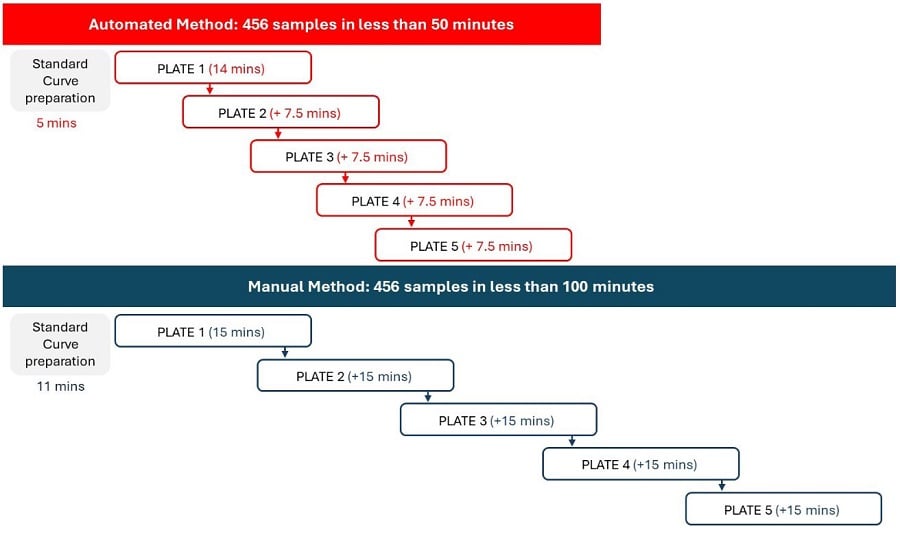
Figure 5. Valita Titer Assay: Automated vs Manual Methods. The method automated on the Biomek i7 workstation allows users to
optimize the time of assay preparation compared to manual operation.
Results
Valita Titer Assay: Automated vs Manual method comparison
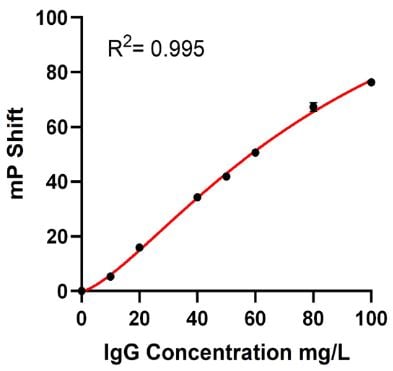
The Valita Titer assay standard curve was executed in parallel on the Biomek i7 workstation and manually. The data was automatically generated by the BioTek Gen5 software (Agilent) using a preset protocol. The R2 value from the Biomek i7-acquired dataset (R2 = 0.995) was comparable to the R2 value obtained with the manual performance (R2 = 0.993). Graphs of the standard curves are shown in Figure 6.
A) Automated Method: Standard Curve
B) Manual Method: Standard Curve
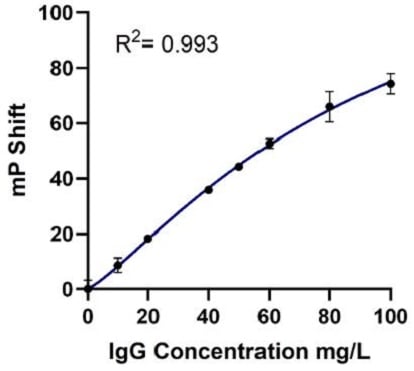
Figure 6. Automated (A) vs Manual (B) Standard Curves: Standard Curves for Valita Titer assay (concentration range: 2.5 to 100 mg/L) were produced in parallel by the Biomek i7 workstation (automated method) and manually (manual method). A four-parameter logistic (4PL) regression model was applied to generate both the automated and manual standard curves.
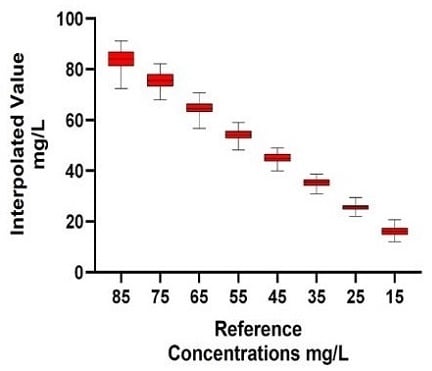
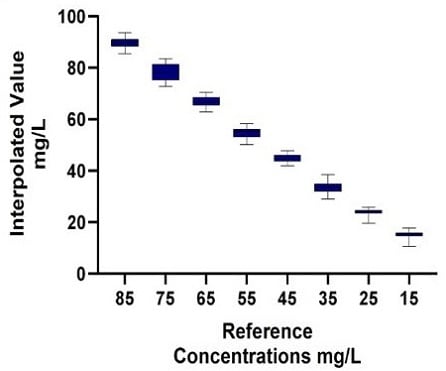
Using the standard curves for interpolation facilitated the quantification of a large number of technical replicate IgG samples (Automated method: 58 technical replicates seeded across 5 x 96-well plates; Manual method: 22 technical replicates seeded across 2 x 96-well plates). The automated Valita Titer assay method demonstrated equivalent variation (% coefficient of variation [%CV]) on average for all sample groups measured, and equivalent accuracy to the manual method when compared to reference concentrations (Figure 7).
A.1) Automated Method: IgG Titer Quantification
A.2)
| Known Sample Conc. (mg/L) | Interpolated Value (mg/L) | SD (mg/L) | CV (%) | Accuracy (%) |
|---|---|---|---|---|
|
85 |
84.1 |
3.7 | 4.4 | 98.9 |
| 75 | 75.7 | 3.1 | 4.1 | 100.9 |
| 65 | 65.1 | 2.6 | 4.0 | 100.1 |
| 55 | 54.2 | 2.2 | 4.1 | 98.5 |
| 45 | 45.0 | 2.2 | 4.9 | 100 |
| 35 | 35.1 | 1.8 | 5.0 | 100.3 |
| 25 | 25.6 | 1.4 | 5.3 | 102.2 |
| 15 | 16.2 | 1.8 | 10.9 | 108.1 |
B.1) Manual Method: IgGTiter Quantification
B.2)
| Known Sample Conc. (mg/L) | Interpolated Value (mg/L) | SD (mg/L) | CV (%) | Accuracy (%) |
|---|---|---|---|---|
|
85 |
89.8 |
2.1 | 2.3 | 105.6 |
| 75 | 78.4 | 3.1 | 4.0 | 104.5 |
| 65& | 66.9 | 2.0 | 3.0 | 103 |
| 55 | 54.8 | 2.1 | 3.7 | 99.7 |
| 45 | 44.8 | 1.5 | 3.3 | 99.4 |
| 35 | 33.6 | 2.1 | 6.4 | 95.8 |
| 25 | 23.9 | 1.5 | 6.1 | 95.5 |
| 15 | 15.2 | 1.4 | 9.2 | 101.6 |
Figure 7. Automated (A) vs Manual (B) IgG Titer Quantification: The Valita Titer assay was used to quantify IgG titer from reference concentration samples. 5 Valita Titer assay plates were run on the Biomek i7 liquid handler (A1); 2 Valita Titer assay plates were run manually (B1). In the respective tables (A2 and B2), Standard deviation (SD), %CV and Accuracy show the variation of samples measured through the Valita Titer assay compared to reference concentrations.
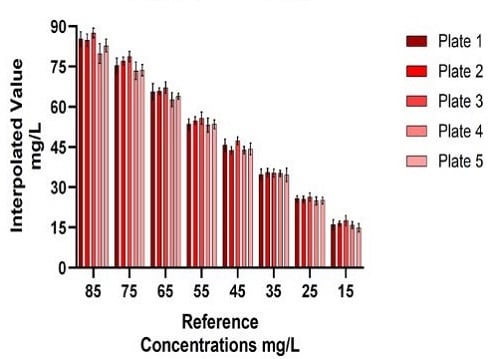
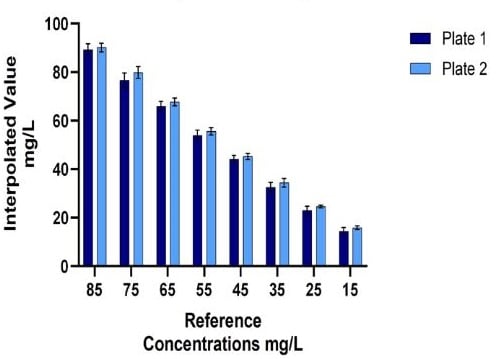
Inter-plate variability was measured to expand upon the precision of the Valita Titer assay despite more plates assessed for the automated method (5) than tested in the manual method (2). The variation between the averages of each sample set concentration from each Valita Titer assay plate showed comparable precision (%CV) across the assay for the automated method as for the manual method (Figure 8).
A.1) Automated Method: IgG Titer Quantification Inter-plate Variability
A.2)
| Known Sample Conc. (mg/L) | Interpolated Value (mg/L) | SD (mg/L) | CV (%) |
|---|---|---|---|
|
85 |
84.1 |
2.9 | 3.5 |
| 75 | 75.7 | 2.3 | 3.0 |
| 65 | 65.1 | 1.8 | 2.7 |
| 55 | 54.2 | 1.1 | 2.1 |
| 45 | 45.0 | 1.5 | 3.4 |
| 35 | 35.1 | 0.4 | 1.1 |
| 25 | 25.6 | 0.6 | 2.2 |
| 15 | 16.2 | 1.0 | 6.2 |
B.1) Manual Method: IgG Titer Quantification Inter-plate Variability
B.2)
| Known Sample Conc. (mg/L) | Interpolated Value (mg/L) | SD (mg/L) | CV (%) |
|---|---|---|---|
|
85 |
89.7 |
0.6 | 0.7 |
| 75 | 78.2 | 2.3 | 2.9 |
| 65 | 66.8 | 1.3 | 1.9 |
| 55 | 54.8 | 1.2 | 2.2 |
| 45 | 44.7 | 0.8 | 1.8 |
| 35 | 33.5 | 1.4 | 4.2 |
| 25 | 23.8 | 1.1 | 4.7 |
| 15 | 15.2 | 1.1 | 6.9 |
Figure 8. Automated (A) vs Manual (B) Valita Titer assay plate repeatability: 5 Valita Titer assay plates were run on the Biomek i7 workstation (A1) and 2 Valita Titer assay plates were run manually (B1). Inter-plate repeatability (%CV) of Valita Titer assay measurements are displayed respectively in tables A2 and B2.
Valita Titer Plus assay accuracy and precision data
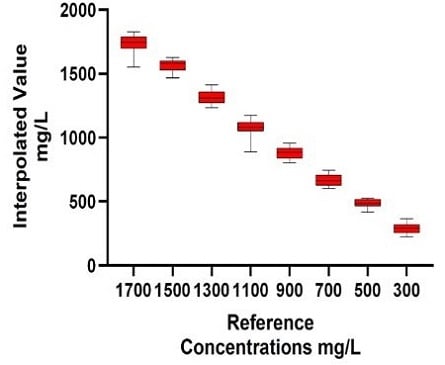
Samples at a higher IgG concentration range (100–2000 mg/L) were also measured through automation of the Valita Titer Plus assay on the Biomek i7 workstation. As demonstrated in Figure 9, the automated assay provided a well-resolved standard curve (R2 = 0.997), high accuracy IgG quantification of samples compared to their reference concentrations (22 technical replicates seeded in 2 x 96-well plates) and high inter- and intra-plate precision (%CV).
A) Automated Method: Standard Curve
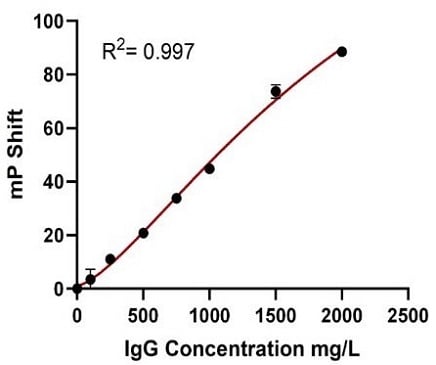
Figure 9. The Automated Valita Titer Plus Assay Method Results: The standard curve for Valita Titer Plus assay, concentration range (100 to 2000 mg/L) performed on the Biomek i7 workstation (A). The box and whisker plot shows accuracy of samples of a known concentration, quantified during the assay (B1). Table B2 shows the averages of all interpolated results across both plates. The %CV highlights the precision of samples measured through the Valita Titer Plus assay, with % accuracy included to acknowledge a comparison against their known concentrations. Inter-plate variability was assessed for the two Valita Titer Plus assay plates run in the assay (C1). The Valita Titer Plus assay inter-plate variability (%CV) was assessed using the average results from each plate, which are displayed in table C2.
B.1) Automated Method: IgG Titer Quantification
B.2)
| Known Sample Conc. (mg/L) | Interpolated Value (mg/L) | SD (mg/L) | CV (%) | Accuracy (%) |
|---|---|---|---|---|
|
1700 |
1739.28 |
65.13 | 3.74 | 102.3 |
| 1500 | 1565.15 | 48.34 | 3.09 | 104.3 |
| 1300 | 1315.59 | 53.09 | 4.04 | 101.2 |
| 1100 | 1081.38 | 58.2 | 5.38 | 98.3 |
| 900 | 886.28 | 44.58 | 5.03 | 98.5 |
| 700 | 668.9 | 42.02 | 6.28 | 95.6 |
| 500 | 488.06 | 31.24 | 6.4 | 97.6 |
| 300 | 290.28 | 39.9 | 13.75 | 96.8 |
C.1) Automated Method: IgG Titer Quantification Inter-plate Variability

C.2)
| Known Sample Conc. (mg/L) | Interpolated Value (mg/L) | SD (mg/L) | CV (%) | Accuracy (%) |
|---|---|---|---|---|
|
1700 |
1741.2 |
65.13 | 29.2 | 1.7 |
| 1500 | 1566.7 | 48.34 | 24.1 | 1.5 |
| 1300 | 1315.9 | 53.09 | 4.4 | 0.3 |
| 1100 | 1082.3 | 58.2 | 14.3 | 1.3 |
| 900 | 888.4 | 44.58 | 32.4 | 3.6 |
| 700 | 670.1 | 42.02 | 18.4 | 2.7 |
| 500 | 489.4 | 31.24 | 20.3 | 4.2 |
| 300 | 291.9 | 39.9 | 25.5 | 8.7 |
Summary
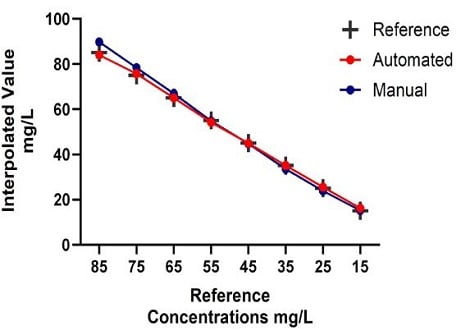
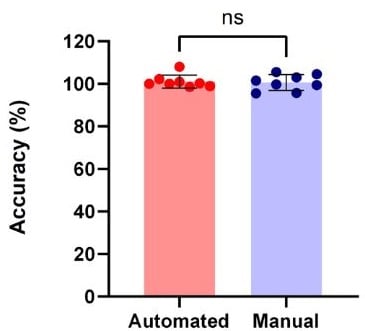
This application note demonstrates the advantages of using an automated method for high-throughput IgG quantification in solution. The percentage error for accuracy and precision was measured to compare the automated and manual IgG quantification measurements for each sample concentration subset against their reference concentrations. Accuracy determines measurement closeness to their true or reference value, with precision measuring the variation within a sample set. Through the automated Valita Titer assay method, accuracy and precision of data acquired using the Biomek i7 liquid handling system were comparable to data collected manually, without statistically significant differences (Figure 10). While comparability of data was observed, the automated method allowed a significant reduction in workflow time (Table 2).
A) Automated vs Manual Method: IgG Titer Quantification
| Automated method |
Manual method |
|
|
Correlation (R2) Reference conc. |
1.000 | 0.999 |
B) Automated vs Manual Method: IgG Titer Accuracy
| Automated method |
Manual method |
|
|
Accuracy Error (%) |
9.6 | 10.1 |
| Precision Error (%) |
1.1 | 1.3 |
Figure 10. Accuracy comparison of automated vs manual IgG quantification measurements using the Valita Titer assay. The Pearson test was used to determine the correlations of IgG titer measurements of samples at known concentration by automated method and manual method compared to their reference values (A). IgG measurement accuracy and precision comparison between automated and manual methods (B).
Automated Valita Titer assay method on a Biomek i7 workstation enables IgG quantification of 480 samples in < 50 minutes
| Method | Time of standard curve preparation | Time of assay (96 tests) | Time of assay (480 tests) | Walk-away Time (480 tests) |
|---|---|---|---|---|
|
Automated |
5 mins |
11 mins | 49 mins | 100% |
|
Manual |
11 mins | 15 mins | 80-100* mins | 30% |
Table 2. Time comparison of automated vs manual IgG quantification method using the Valita Titer assay. * Time workflow dependent.
The data shown suggests that the automated Valita Titer and Valita Titer Plus assay workflows can be used to successfully upgrade the manual workflow, maintaining the standard of results, reducing hands-on time and error-prone steps while halving the time needed to measure 480 samples.
About Biomek i-Series Systems
The Biomek i7 liquid handling systems are designed for instrument integration, including the flexibility to interchange between Span-8 and multichannel pipetting, enhancing opportunities for high-throughput analysis. Labware integrations (e.g., plate readers, incubators, plate shakers, plate washers) into automation platforms can contribute to enhanced throughput efficiency, significantly reduced hands-on time and enhanced data quality of your workflows.
Biomek i-Series systems have demonstrated their analytical value for biotherapeutic drug development and manufacturing. Application notes are available demonstrating Biomek-automated solutions for, but not limited to, determining residual Protein-A, HCP clearance, and characterizing N-linkedglycans.
About BioTek Plate Readers
Agilent BioTek multimode microplate readers provide modularity and upgradability, allowing diverse workflow and data analysis needs and can be readily integrated into the Biomek i7 workstation. BioTek multimode readers enable measurements of a range of imaging and plate-based assays, including Valita Titer assay, ELISA, growth, metabolic and enzyme kinetics. Integration of a BioTek Cytation 1 Cell Imaging Multimode Reader (Agilent) with the Biomek i7 workstation enables a seamless flow of analytics, data generation and analysis of results.
References
- Lu, RM., Hwang, YC., Liu, IJ. et al. Development of therapeutic antibodies for the treatment of
diseases. J Biomed Sci 27, 1 (2020). https://doi.org/10.1186/s12929-019-0592-z - https://www.opastpublishers.com/open-access-articles/therapeutic-monoclonal-antibodiesapproved-
by-fda-in-2023.pdf - https://www.grandviewresearch.com/industry-analysis/biologics-market
Materials and Reagents
Hardware
| Description | Manufacturer |
|---|---|
| Beckman Coulter Life Sciences | |
|
BioTek Cytation 1 Cell Imaging Multimode Reader |
Agilent |
Labware and consumables
| Part Number | Description | Manufacturer |
|---|---|---|
| B85911 |
BC190F Pipette tips |
Beckman Coulter Life Sciences |
| B85955 | BC1025F Pipette tips | Beckman Coulter Life Sciences |
| 609844 | BCFlat96 96-well polystyrene clear plates | Beckman Coulter Life Sciences |
| VAL003 | Valita Titer 96-well plates | Beckman Coulter Life Sciences |
| VAL004 | Valita Titer Plus 96-well plates | Beckman Coulter Life Sciences |
| 10565672 | Black universal microplate lids | Corning |
| 95040452 | Nunc 96-Well DeepWell Plates | Thermo Fisher Scientific |
| 201244-100 | 300 mL, Reservoir | Agilent Technologies |
| 009-0102 | Human IgG | Rockland |
| 10743-011 | CD CHO Medium | Gibco |

